Let’s see what happens with a dummy load with the frequency range of 0MHz to 30MHz.
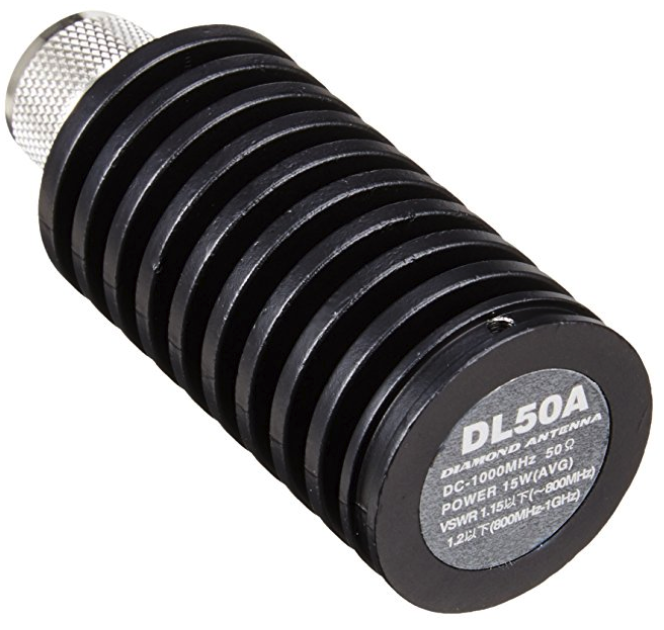
The above figure shows the impedance curve.
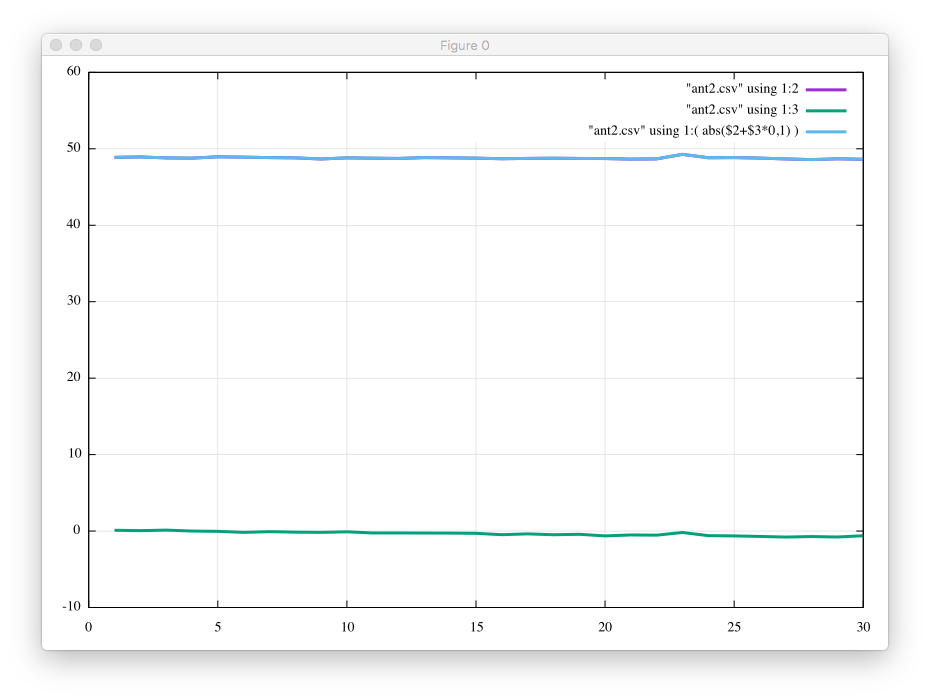
This figure shows return loss.
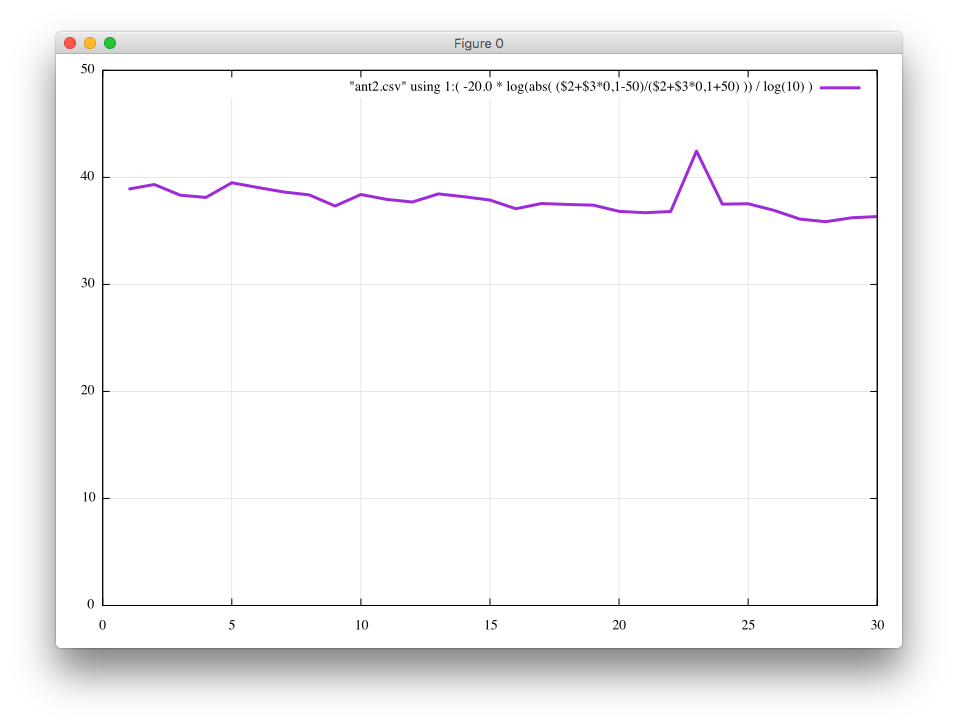
VSWR is shown in the above figure.
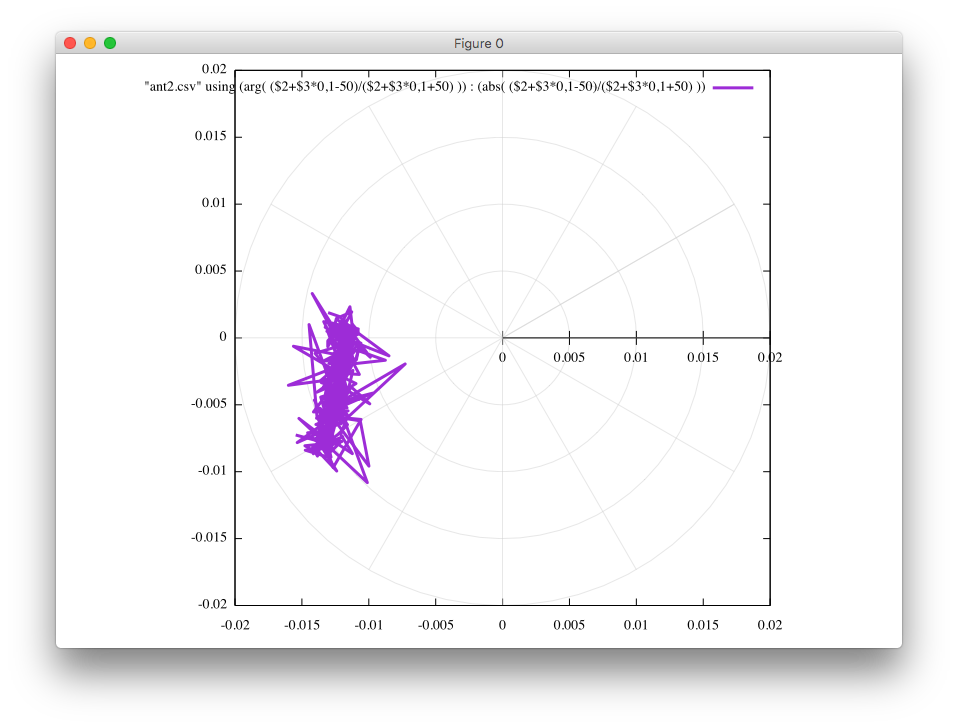
The above two figures are the Smith Chart.

Ham Radio Blog
Let’s see what happens with a dummy load with the frequency range of 0MHz to 30MHz.
The above figure shows the impedance curve.
This figure shows return loss.
VSWR is shown in the above figure.
The above two figures are the Smith Chart.