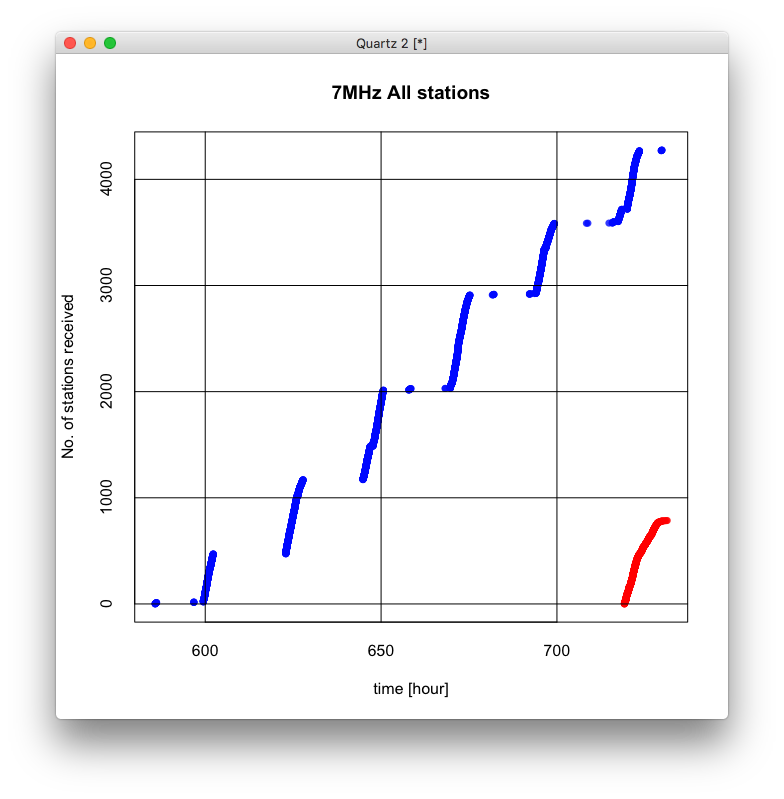
ADIF data for the last week.
Just for the last several hours.
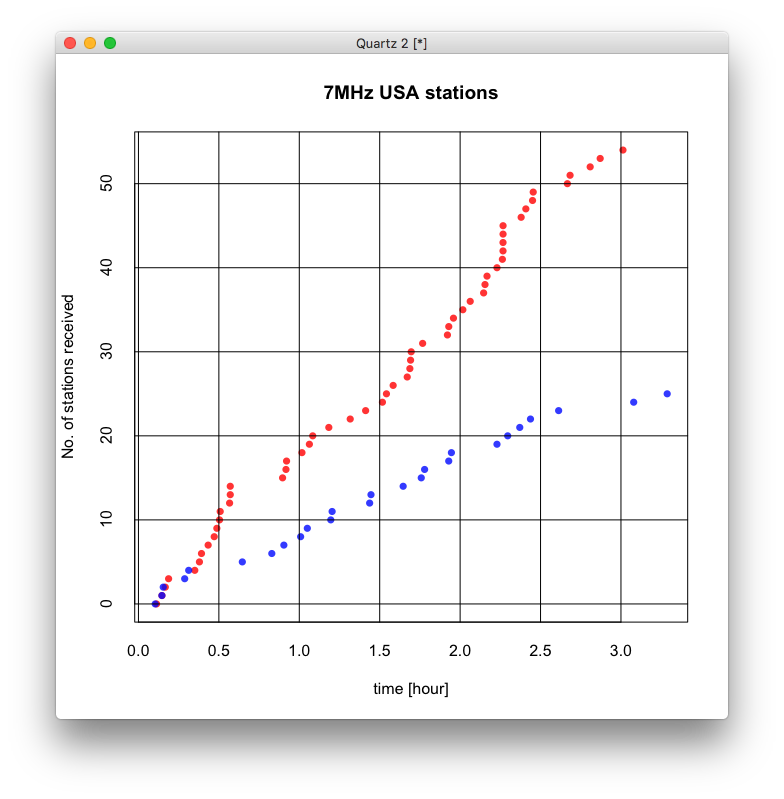
Only the USA stations.

Ham Radio Blog
ADIF data for the last week.
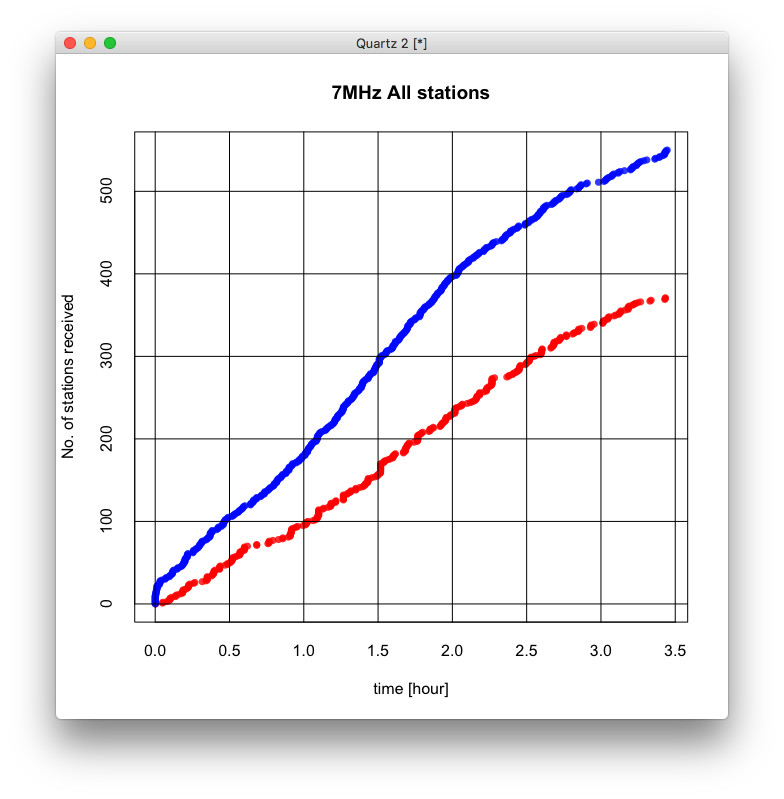
Just for the last several hours.
Only the USA stations.
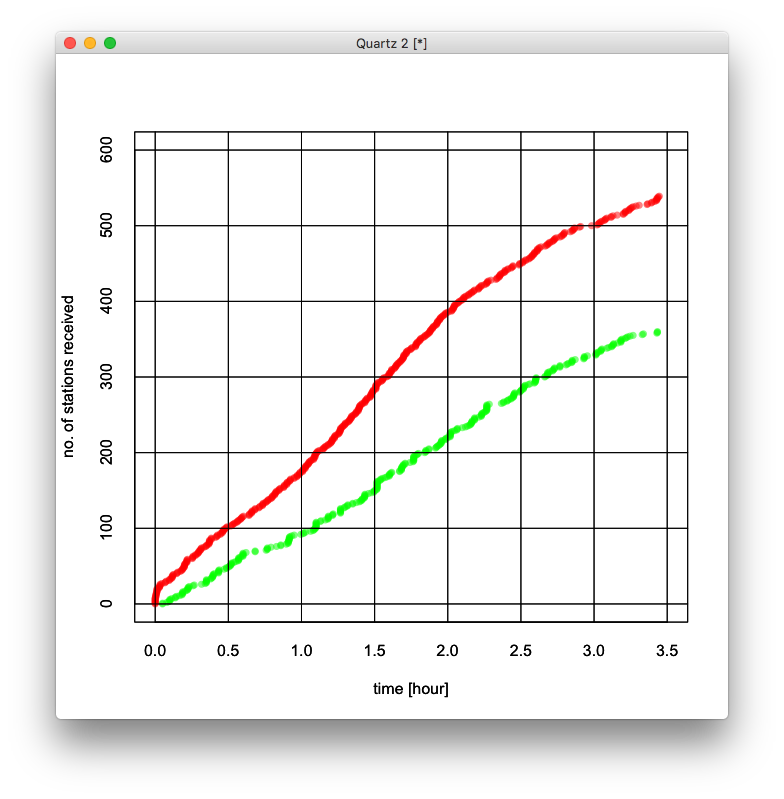
Not QSO rates, but reporting rates. The graph is for all stations.
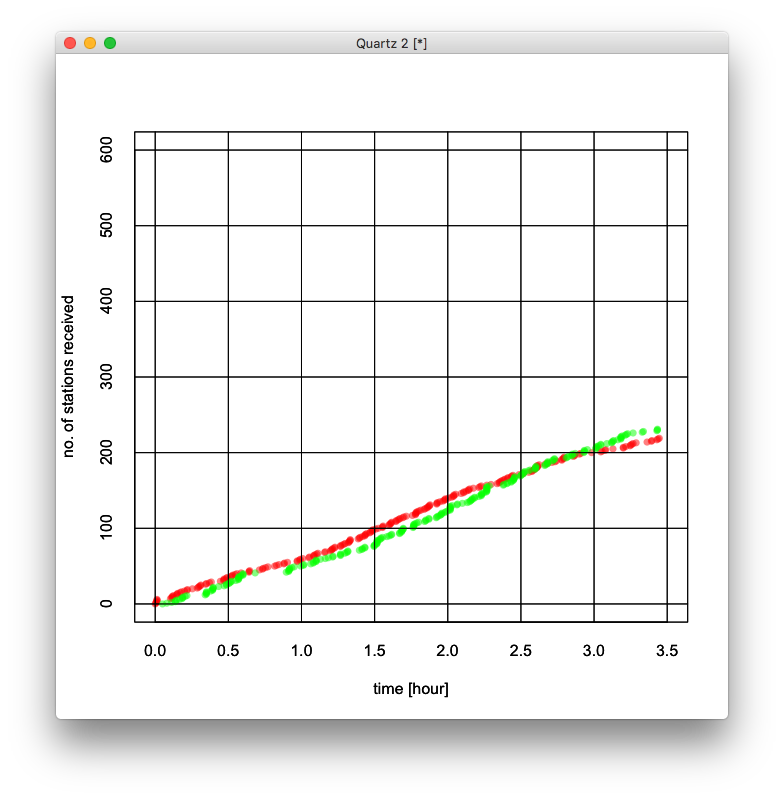
This is for Non-JA stations.
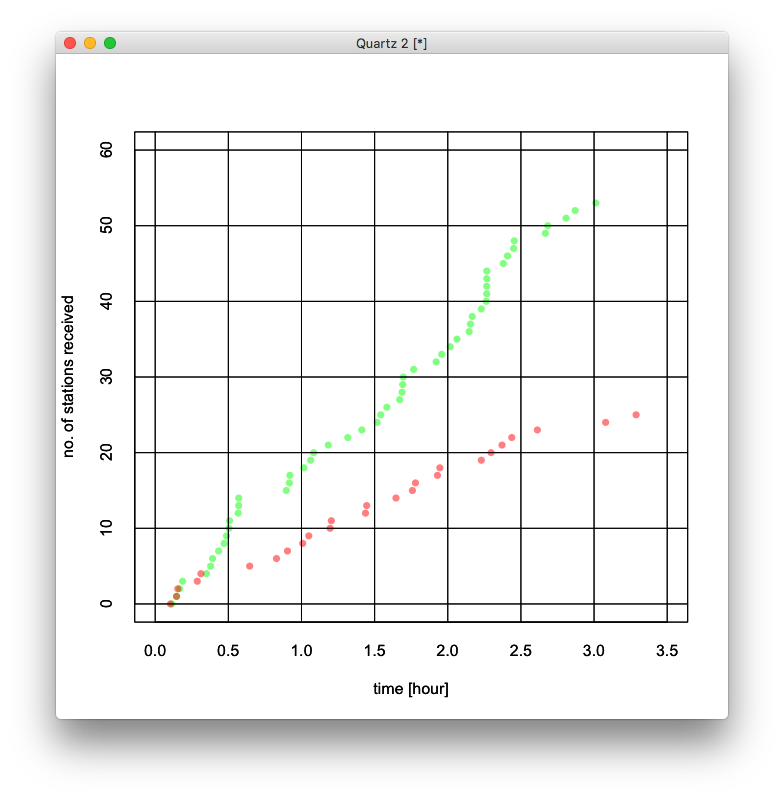
This is for USA stations only.
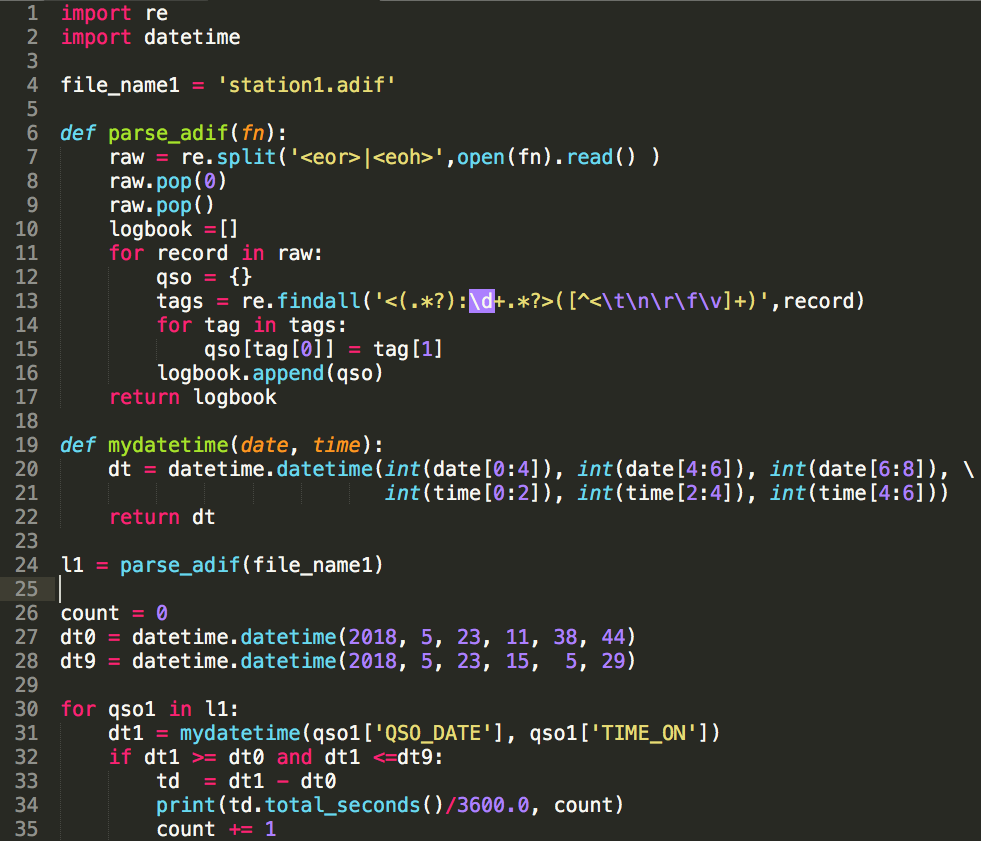
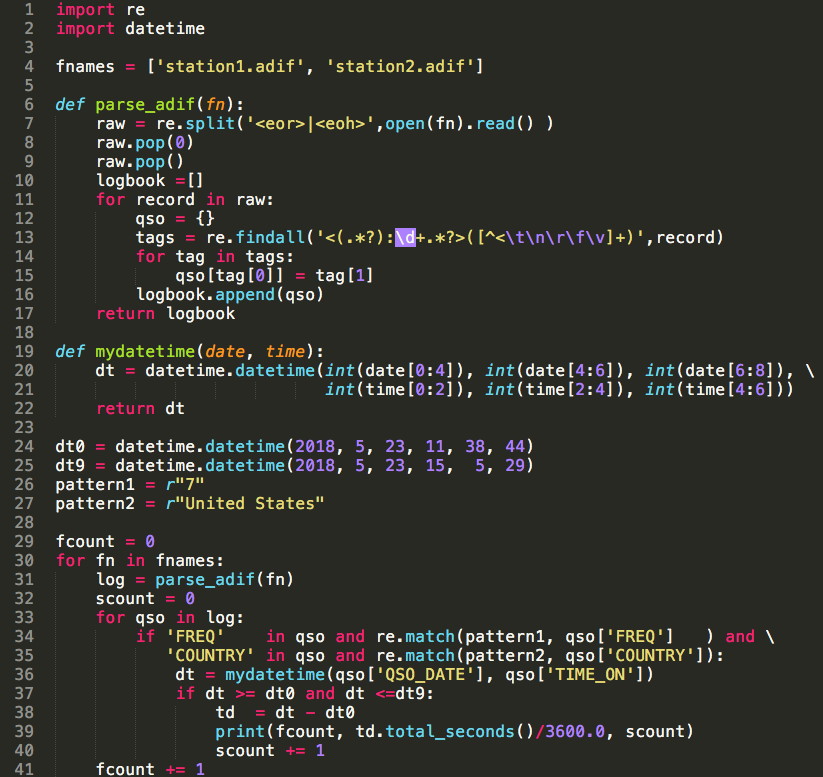
import re
import datetime

file_name1 = 'station1.adif'

def parse_adif(fn):
    raw = re.split('<eor>|<eoh>',open(fn).read() )
    raw.pop(0)
    raw.pop()
    logbook =[]
    for record in raw:
        qso = {}
        tags = re.findall('<(.*?):\d+.*?>([^<\t\n\r\f\v]+)',record)
        for tag in tags:
            qso[tag[0]] = tag[1]
        logbook.append(qso)
    return logbook

def mydatetime(date, time):
    dt = datetime.datetime(int(date[0:4]), int(date[4:6]), int(date[6:8]), \
                           int(time[0:2]), int(time[2:4]), int(time[4:6]))
    return dt

l1 = parse_adif(file_name1)

count = 0
dt0 = datetime.datetime(2018, 5, 23, 11, 38, 44)
dt9 = datetime.datetime(2018, 5, 23, 15,  5, 29)

for qso1 in l1:
    dt1 = mydatetime(qso1['QSO_DATE'], qso1['TIME_ON'])
    if dt1 >= dt0 and dt1 <=dt9:
        td  = dt1 - dt0
        print(td.total_seconds()/3600.0, count)
        count += 1
% cat stationXYZ.adif | grep FREQ:8\>7\. | grep PSKREP | grep -v Japan > station1.adif
% python3 adif_parse.py > data1.csv
% R
> data1=read.csv("data1.csv", header=F, sep="")
> data2=read.csv("data2.csv", header=F, sep="")
> plot(data1$V1, data1$V2, xlab="time [hour]", ylab="no. of stations received", pch=16, col="#00ff0080", tck=1, xlim=c(0.0, 3.5), ylim=c(0,600))
> par(new=T)
> plot(data2$V1, data2$V2, xlab="time [hour]", ylab="no. of stations received", pch=16, col="#ff000080", tck=1, xlim=c(0.0, 3.5), ylim=c(0,600))
Station 1:
from: QSO_DATE: 20180517, TIME_ON: 033544
to: QSO_DATE: 20180523, TIME_ON: 212959
5067 lines.
Station 2:
from: QSO_DATE: 20180523, TIME_ON: 104403
to: QSO_DATE: 20180524, TIME_ON: 025314
3504 lines.
First match: QSO_DATE: 20180523, TIME_ON: 113844
Last match: QSO_DATE: 20180523, TIME_ON: 212959
909 matches are found.
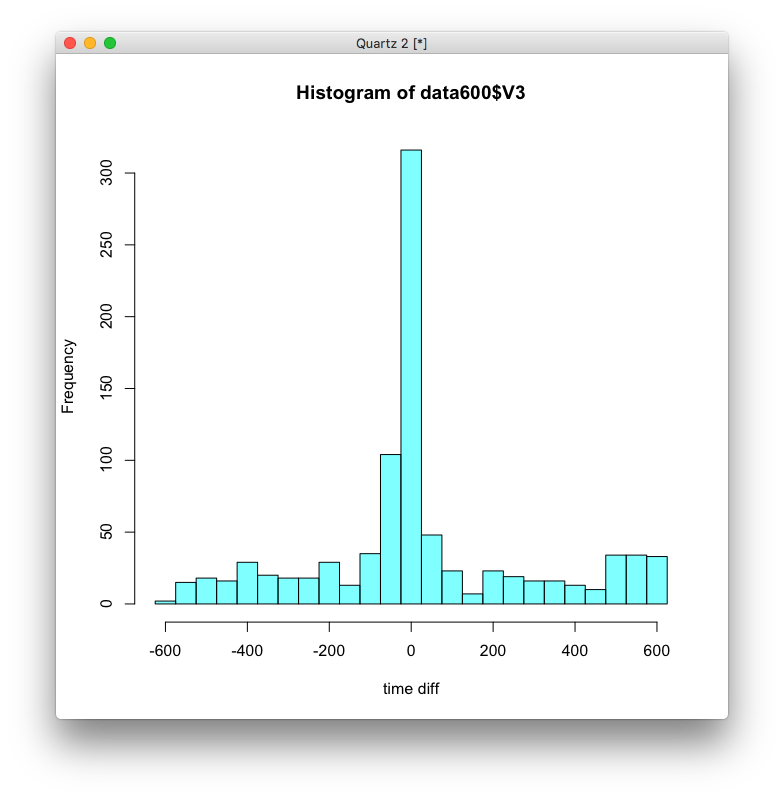
The difference of two “TIME_ON”s between the two stations. In most cased, the same DX station is reported at the same time.
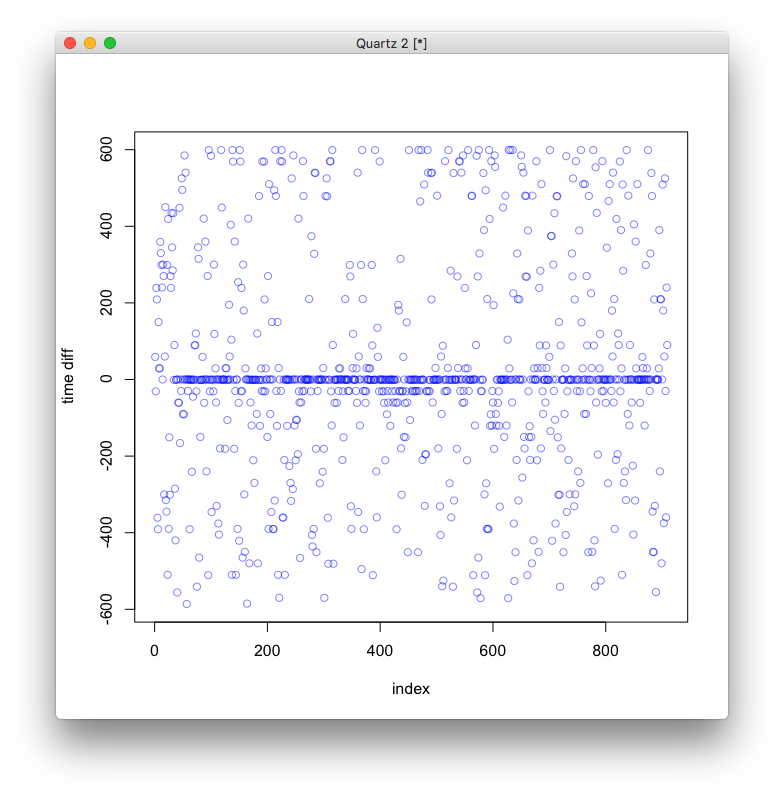
The time difference is in sec.
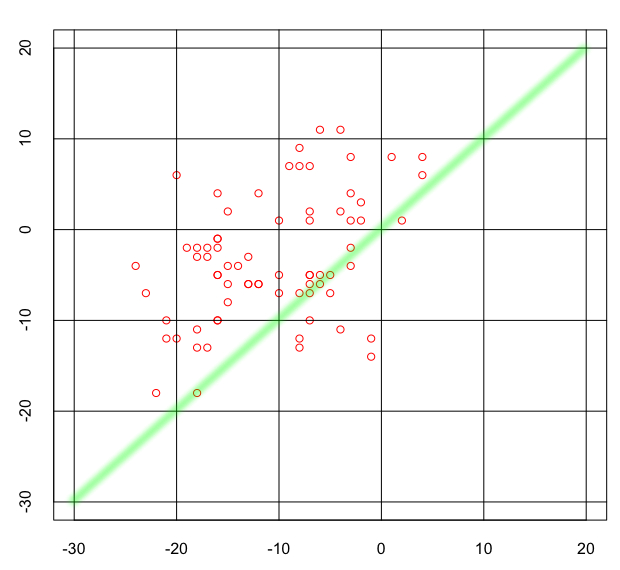
The SNR comparison with the time difference of 0 sec (green), and within 600 sec (red).
file_name1 = 'station1.adif'
file_name2 = 'station2.adif'

def parse_adif(fn):
    raw = re.split('<eor>|<eoh>',open(fn).read() )
    raw.pop(0)
    raw.pop()
    logbook =[]
    for record in raw:
        qso = {}
        tags = re.findall('<(.*?):\d+.*?>([^<\t\n\r\f\v]+)',record)
        for tag in tags:
            qso[tag[0]] = tag[1]
        logbook.append(qso)
    return logbook

def time2sec(time):
    sec = int(time[0:2])*60*60+int(time[2:4])*60+int(time[4:6])
    return sec

l1 = parse_adif(file_name1)
l2 = parse_adif(file_name2)

pattern = r"7."

for qso1 in l1:
    if re.match(pattern, qso1['FREQ']):
        for qso2 in l2:
            if (qso1['CALL'] in qso2.values()):
                if (qso1['QSO_DATE'] == qso2['QSO_DATE']):
                    time1 = time2sec(qso1['TIME_ON'])
                    time2 = time2sec(qso2['TIME_ON'])
                    if (abs(time1 - time2) < 600):
                        print(qso1['APP_PSKREP_SNR'], qso2['APP_PSKREP_SNR'], time1-time2)
% python3 adif_parse.py > data.csv
% R
> data=read.csv("data.csv", header=F, sep="")
> hist(data$V3, col="#00ffff80", breaks=seq(-625,625,50))
> plot(data$V3, col="#0000ff80", xlab="index", ylab="time diff")
> plot(data$V1, data$V2, xlab="My SNR", ylab="His SNR", pch=16, col="#00ff0080", tck=1, xlim=c(-30,20), ylim=c(-30,20))
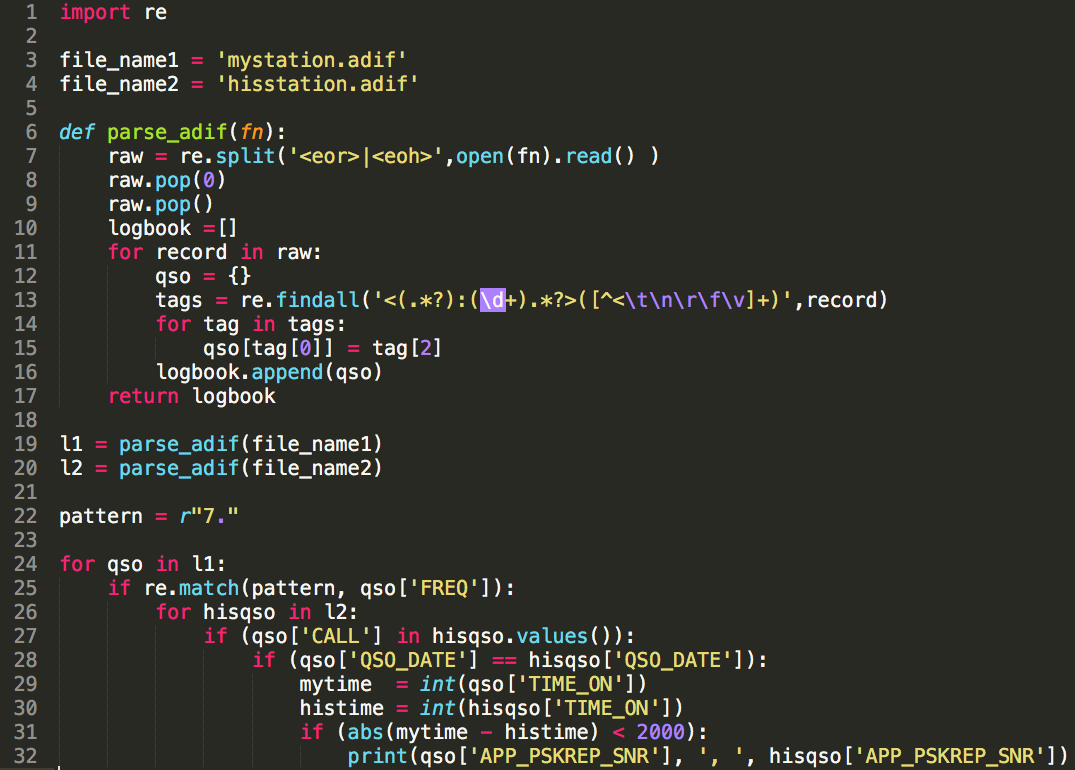
You may wish to compare the SNR values if the same DX stations are received both by you and your neighbour almost at the same time.
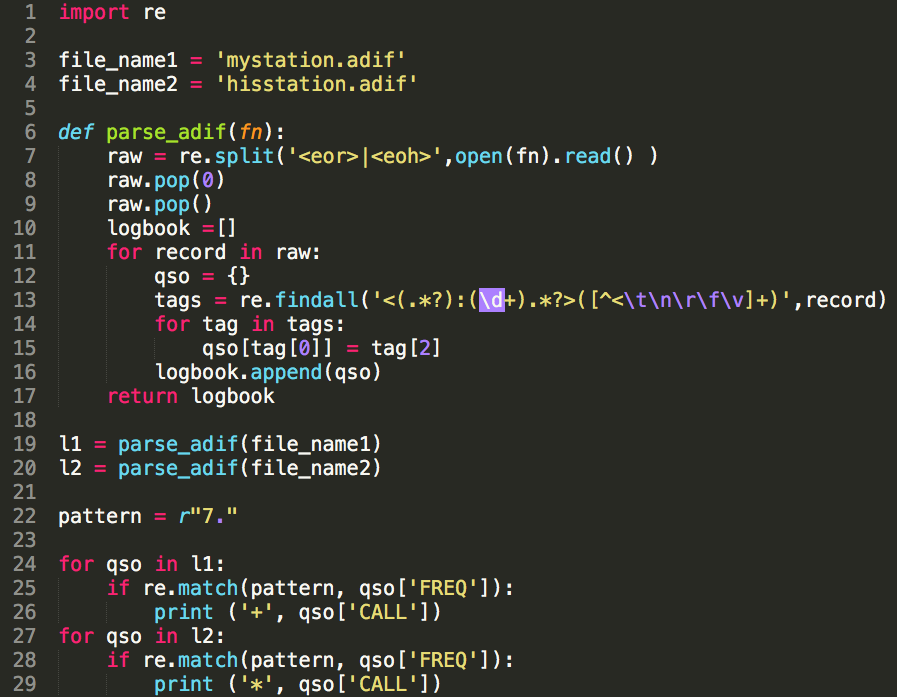
import re

file_name1 = 'mystation.adif'
file_name2 = 'hisstation.adif'

def parse_adif(fn):
    raw = re.split('<eor>|<eoh>',open(fn).read() )
    raw.pop(0)
    raw.pop()
    logbook =[]
    for record in raw:
        qso = {}
        tags = re.findall('<(.*?):(\d+).*?>([^<\t\n\r\f\v]+)',record)
        for tag in tags:
            qso[tag[0]] = tag[2]
        logbook.append(qso)
    return logbook

l1 = parse_adif(file_name1)
l2 = parse_adif(file_name2)

pattern = r"7."

for qso in l1:
    if re.match(pattern, qso['FREQ']):
        for hisqso in l2:
            if (qso['CALL'] in hisqso.values()):
                if (qso['QSO_DATE'] == hisqso['QSO_DATE']):
                    mytime  = int(qso['TIME_ON'])
                    histime = int(hisqso['TIME_ON'])
                    if (abs(mytime - histime) < 2000):
                        print(qso['APP_PSKREP_SNR'], ', ', hisqso['APP_PSKREP_SNR'])
% python3 adif_parse.py  > data.csv
% R
> data=read.csv("data.csv")
> plot(data, tck=1, col="red", xlim=c(-30,20), ylim=c(-30,20))
A map display of PSK reporter is useful for comparing your receiver performance with that of your local stations.
Furthermore, you can download ADIF files of the report from other stations by clicking “Show logbook -> Download ADIF files -> last 24 hours, last week”.
import re

file_name1 = 'mystation.adif'
file_name2 = 'hisstation.adif'

def parse_adif(fn):
    raw = re.split('<eor>|<eoh>',open(fn).read() )
    raw.pop(0)
    raw.pop()
    logbook =[]
    for record in raw:
        qso = {}
        tags = re.findall('<(.*?):(\d+).*?>([^<\t\n\r\f\v]+)',record)
        for tag in tags:
            qso[tag[0]] = tag[2]
        logbook.append(qso)
    return logbook

l1 = parse_adif(file_name1)
l2 = parse_adif(file_name2)

pattern = r"7." # 7MHz band only

for qso in l1:
    if re.match(pattern, qso['FREQ']):
        print ('+', qso['CALL'])
for qso in l2:
    if re.match(pattern, qso['FREQ']):
        print ('*', qso['CALL'])
Here is a short python program to extract information from two ADIF files, typically of your own and of your local station.
% python3 adif_parse.py  > ttt.txt
% grep + ttt.txt | sort | uniq -c | grep -e ' [KWN]' | sort -r
  22 + WD6DBM
  18 + KC7UG
   8 + N7TM
   8 + N5DG
   7 + KW6S
   7 + KN7D
   7 + KE8FT
   6 + N7FN
   6 + KF7PG
   6 + KA7T
   5 + KF5ZTQ
   5 + KE7UIU

% grep '\*' ttt.txt | sort | uniq -c | grep -e ' [KWN]' | sort -r
  15 * N6QQ
  14 * KC7UG
  13 * KN7D
  12 * N7MDW
  11 * K6KY
  10 * N7TR
   9 * N9BD
   9 * N7IY
   9 * K2ANT
   8 * KE7W
   7 * KD7H
   7 * K6TE
The numbers show how many times the DX stations are reported.
This is with an antenna switch.
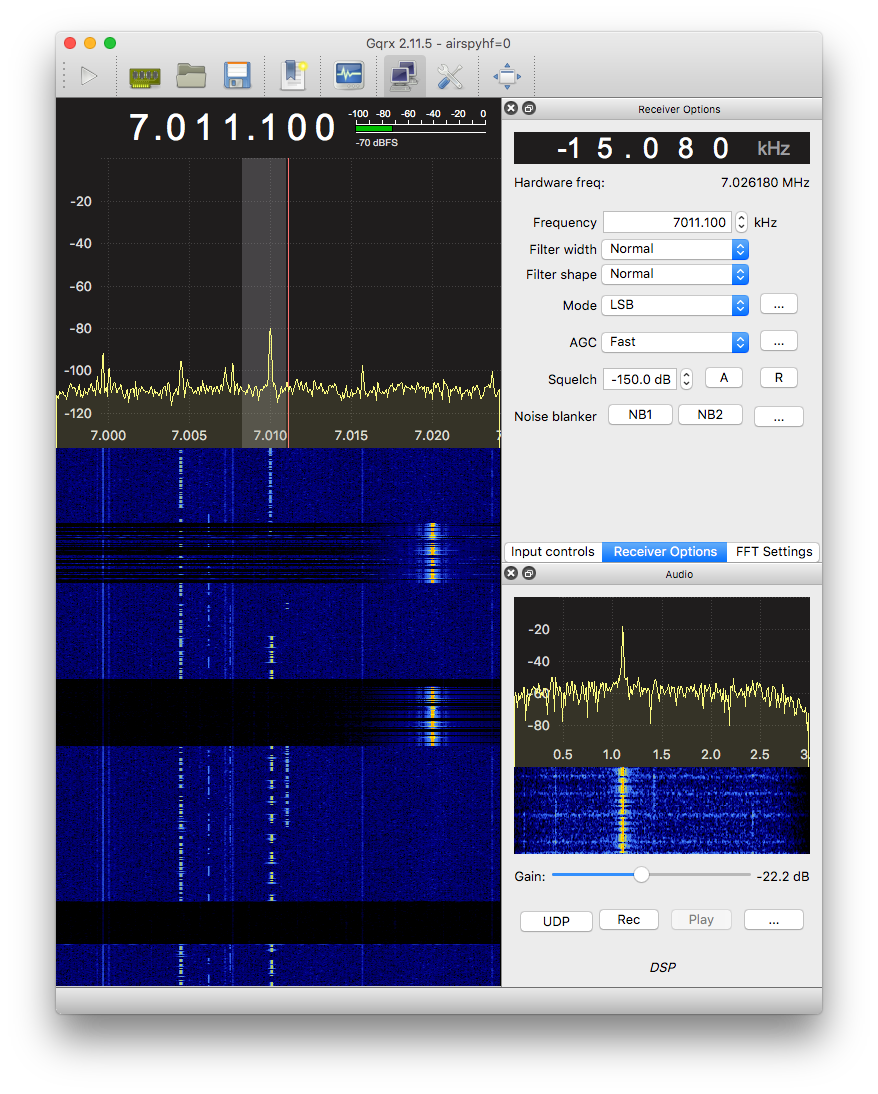
In the waterfall you see the black area at the bottom. There is no RF output power, but only the SNED signal is applied to the switch.
The other two areas show the semi break-in and full break-in operations with the TX frequency of 7.020MHz.
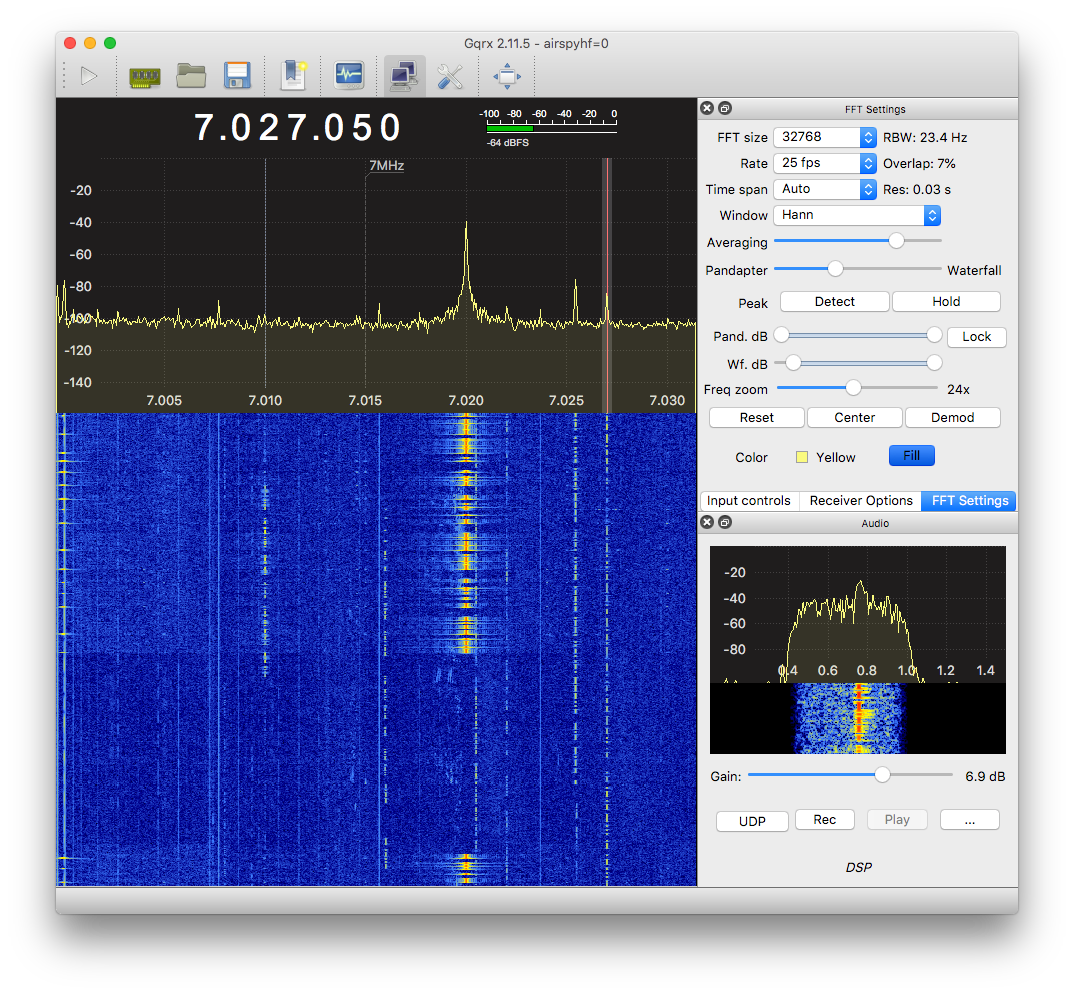
Listening to a signal on 7.027050MHz using a small loop antenna, while transmitting into a dummy load on 7.020MHz.
No discernible interference is observed.
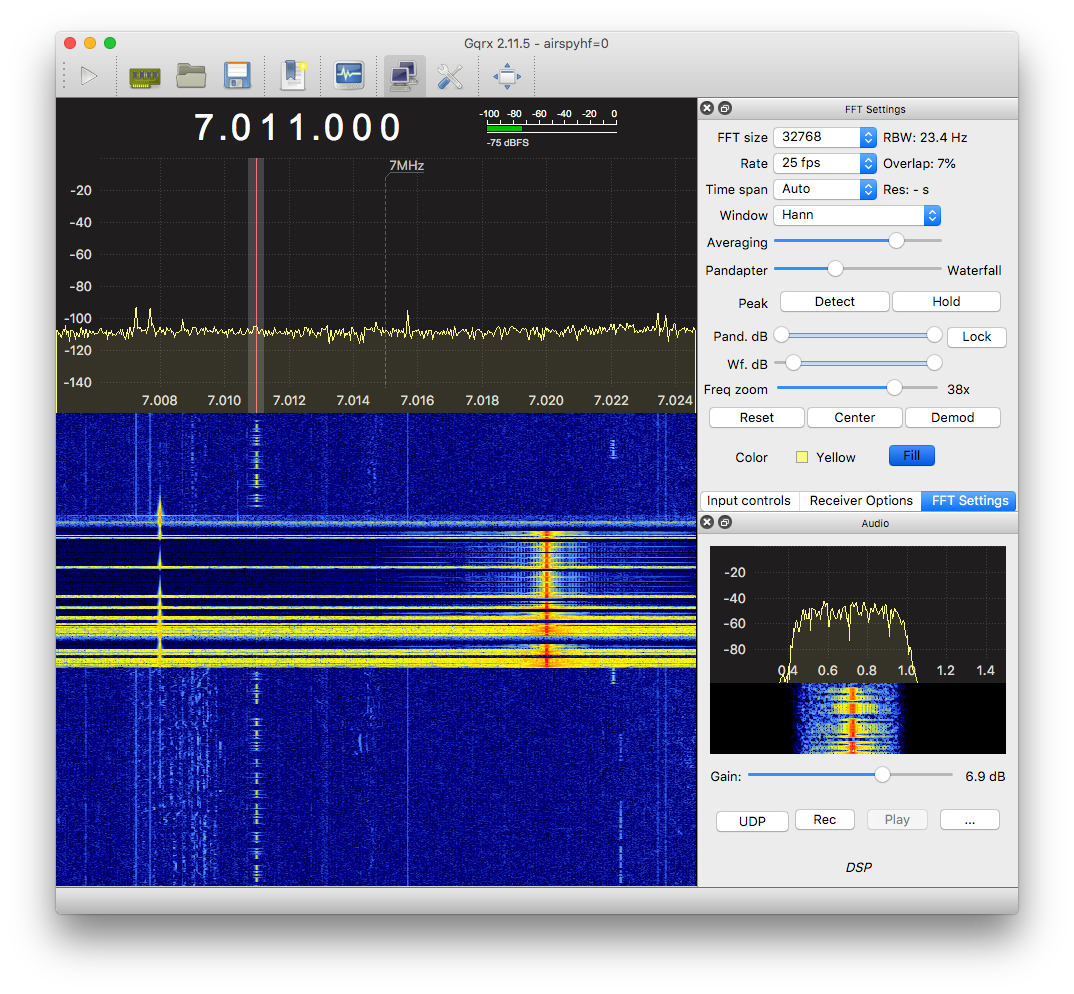
Now, transmitting on the same frequecy, but this time into a dipole antenna. Note that the two antennas are arranged very close each other due to the limited space available.
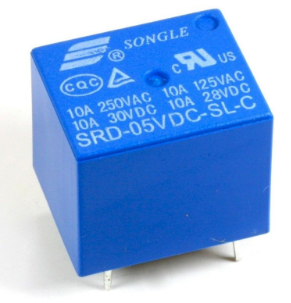
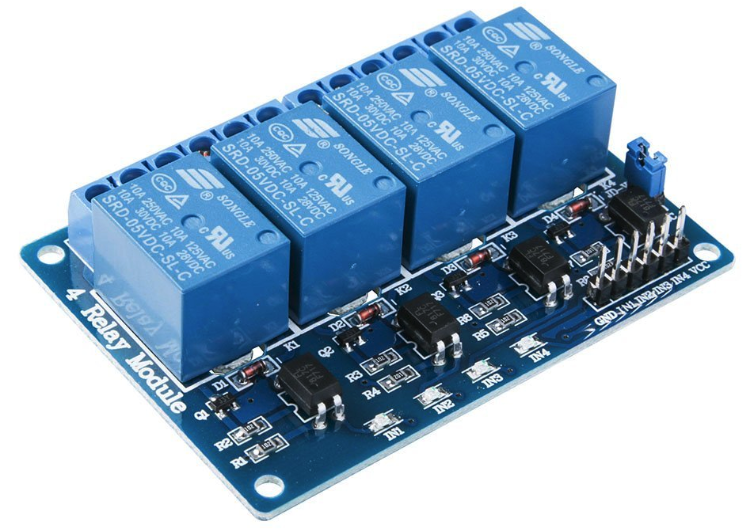
This is the relay used in my antenna switch.
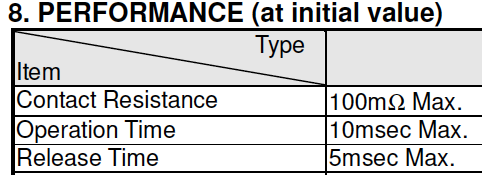
Let’s see if these operate and release times are correct.
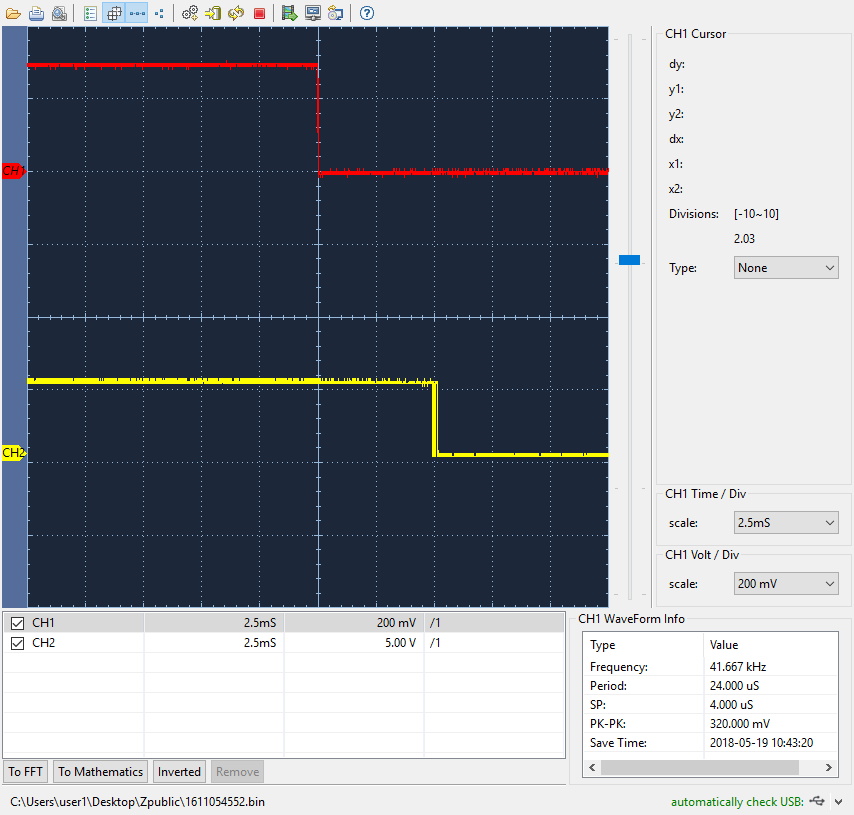
The SEND signal from IC-7410 is in red, and the DC voltage applied to the normally open contact in yellow.
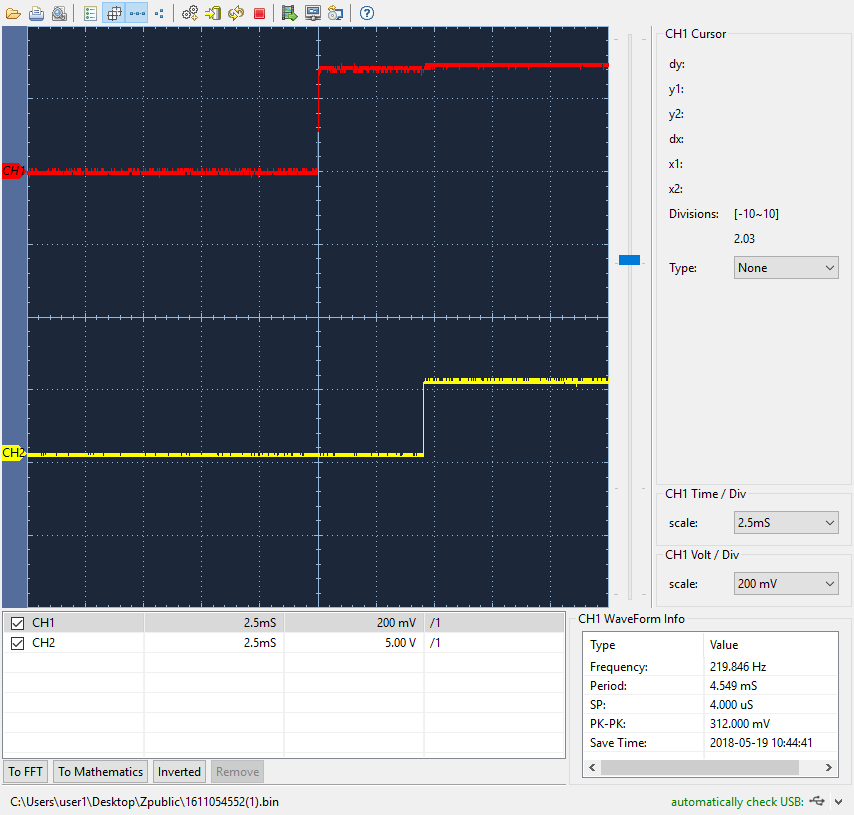
The operate time is around 5 ms, and the release time is around 4 ms.
I intend to use a small loop antenna for HF+ SDR, and a dipole for IC-7410. But, since the two antennas are very close each other, I thought it might be better to use an antenna switch to protect my SDR.
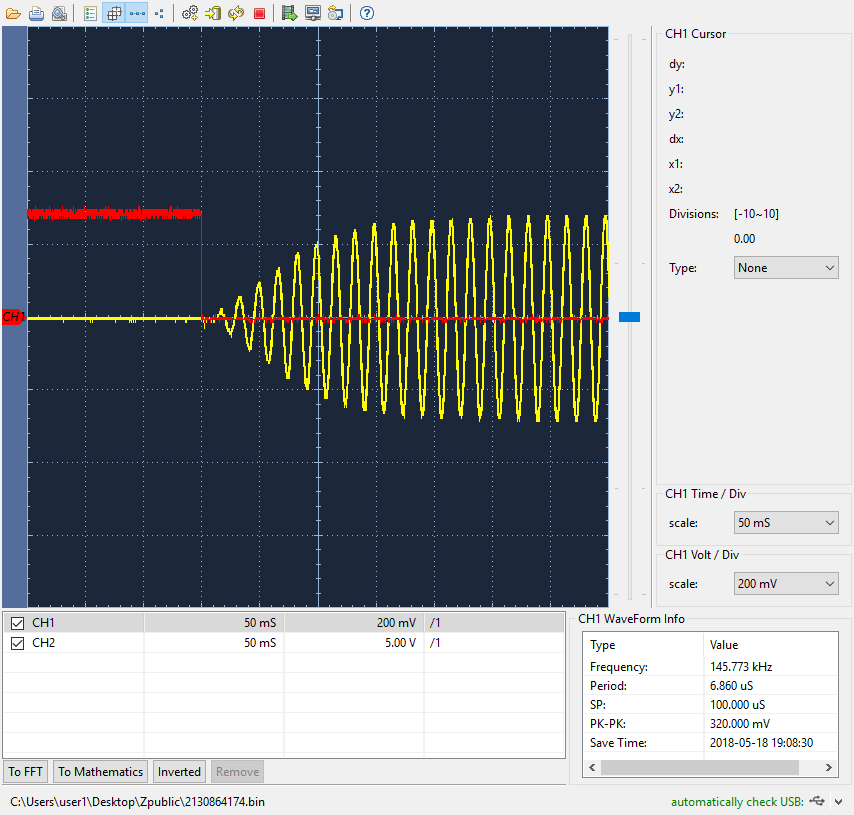
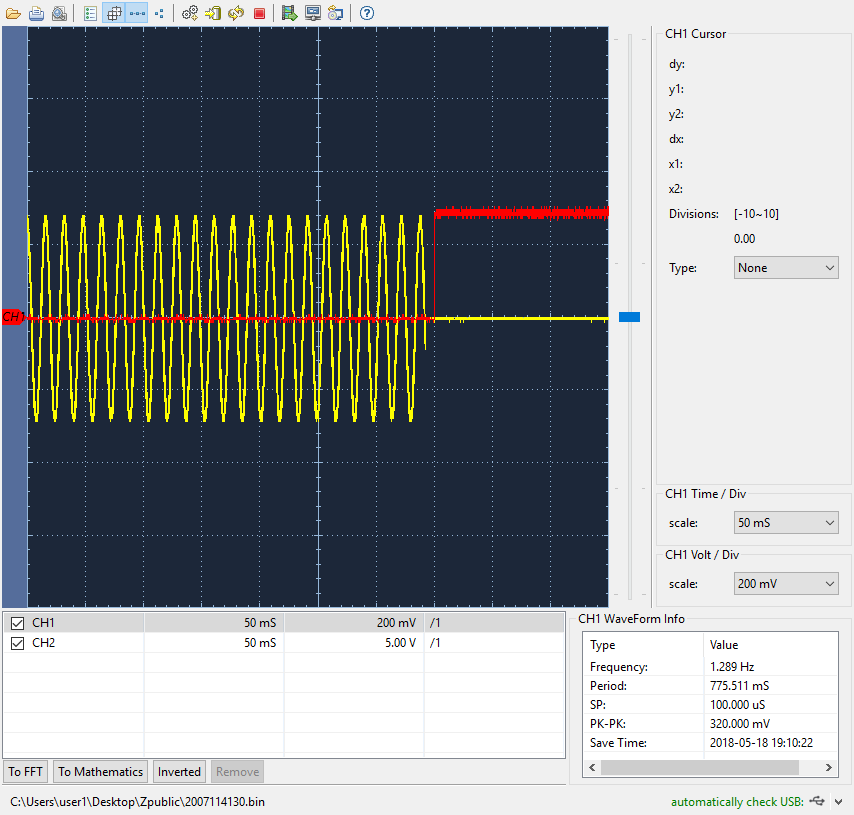
The SEND signal from IC-7410 is shown as a red trace, and the RF output signal at 7MHz as yellow.
Of course, I need to check the delay due to the mechanical relay.
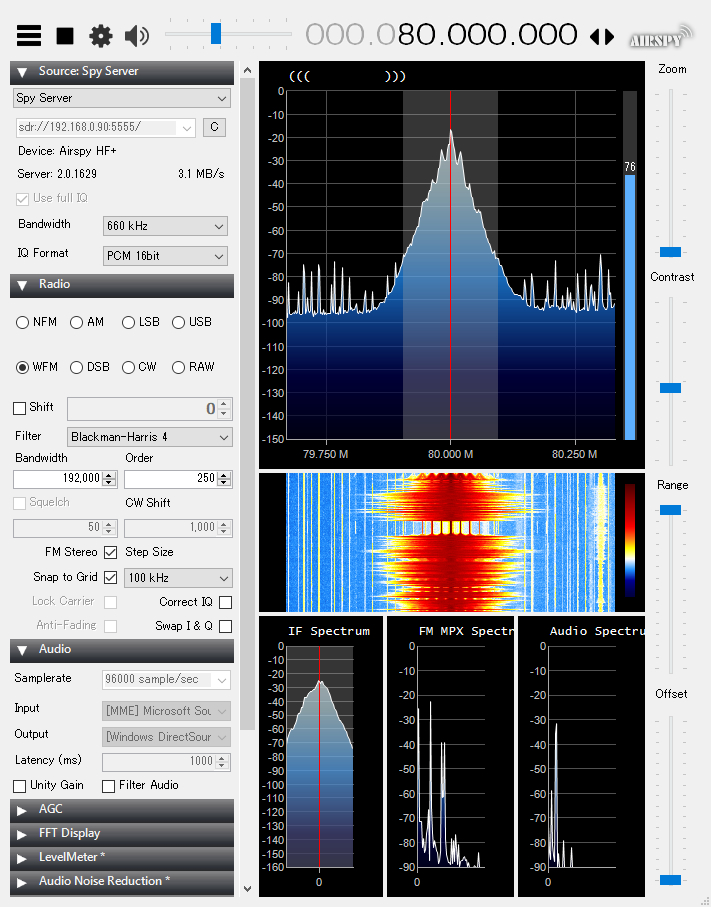
HF+ is accessible over the network using a SpyServer.
[Ubuntu 18.04] % ./spyserver
SPY Server v2.0.1629 - http://airspy.com
Reading the configuration file: spyserver.config
Listening for connections on 0.0.0.0:5555
Accepted client 192.168.0.108:65062 running SDR# v1.0.0.1666 on Microsoft Windows NT 6.2.9200.0
Device was sleeping. Wake up!
Acquired the device
Changed streaming mode => 1
Changed display pixels for FFT stream => 1000
Changed dB offset for FFT stream => 0
Changed dB range for FFT stream => 127
Changed digital gain for  IQ stream => Automatic
Changed format for FFT stream => 1
Changed format for  IQ stream => 2
Changed frequency for  IQ stream => 100000000 Hz
Changed format for  IQ stream => 2
Changed streaming state => 1
Changed frequency for  IQ stream => 90000000 Hz
Changed frequency for  IQ stream => 80000000 Hz