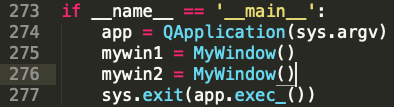
Creating two instances.
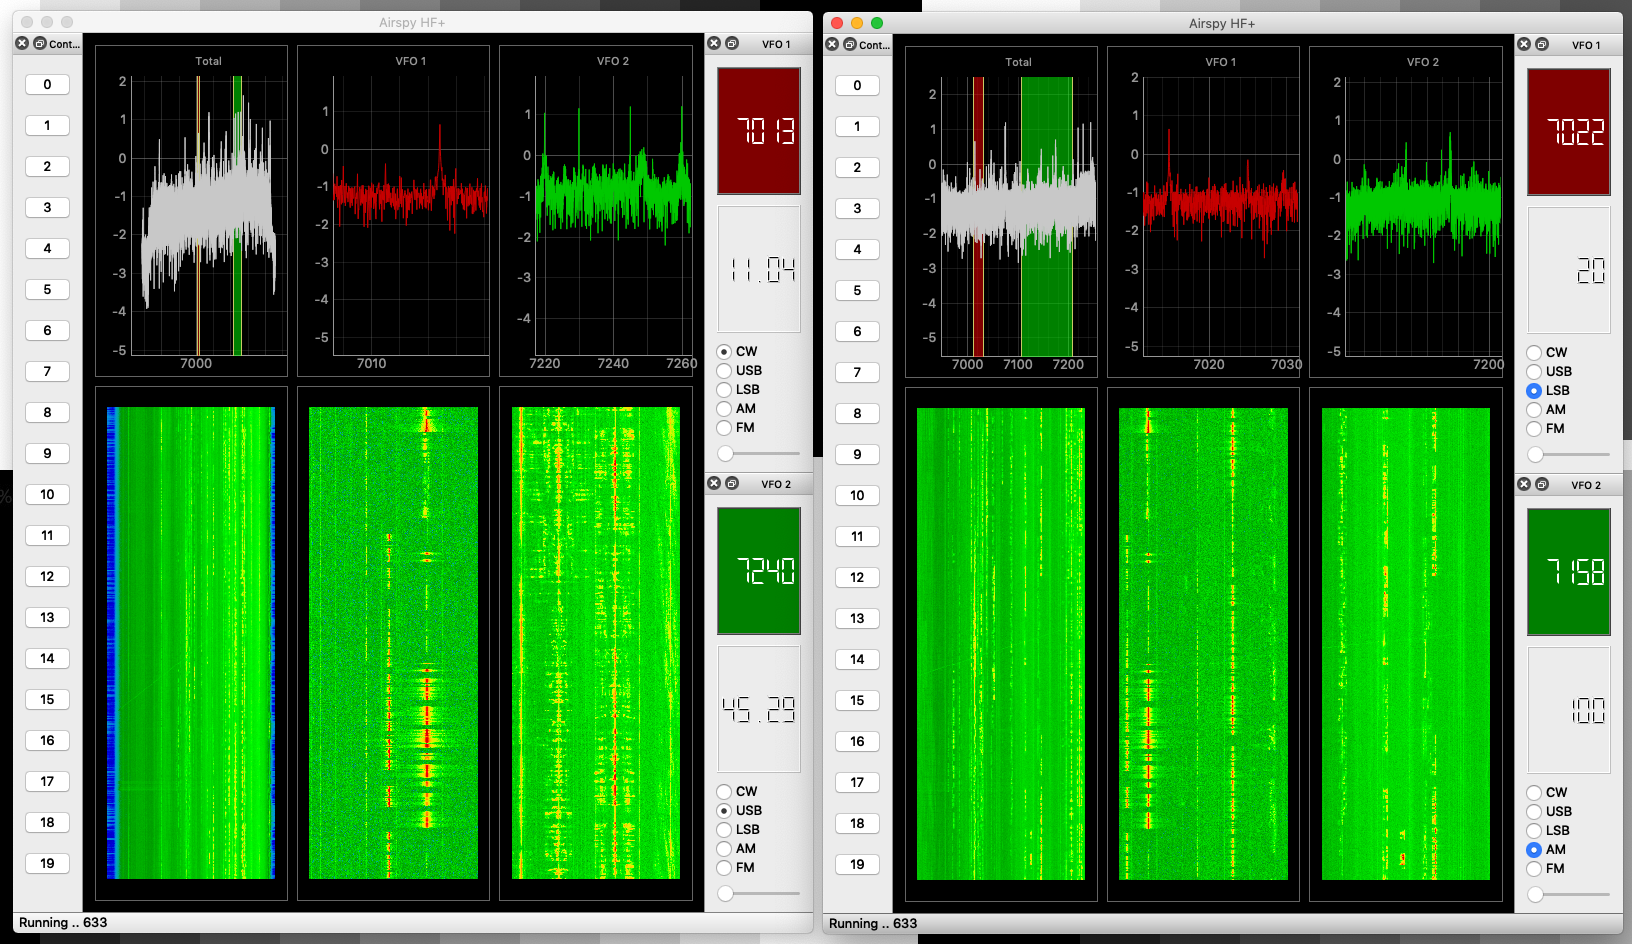
Each window can be controlled separately.

Ham Radio Blog
Creating two instances.
Each window can be controlled separately.
Now coding the GUI part of the program.
Left button drag will shift the center frequency, and Right button drag will expand or shrink the bandwidth shown.
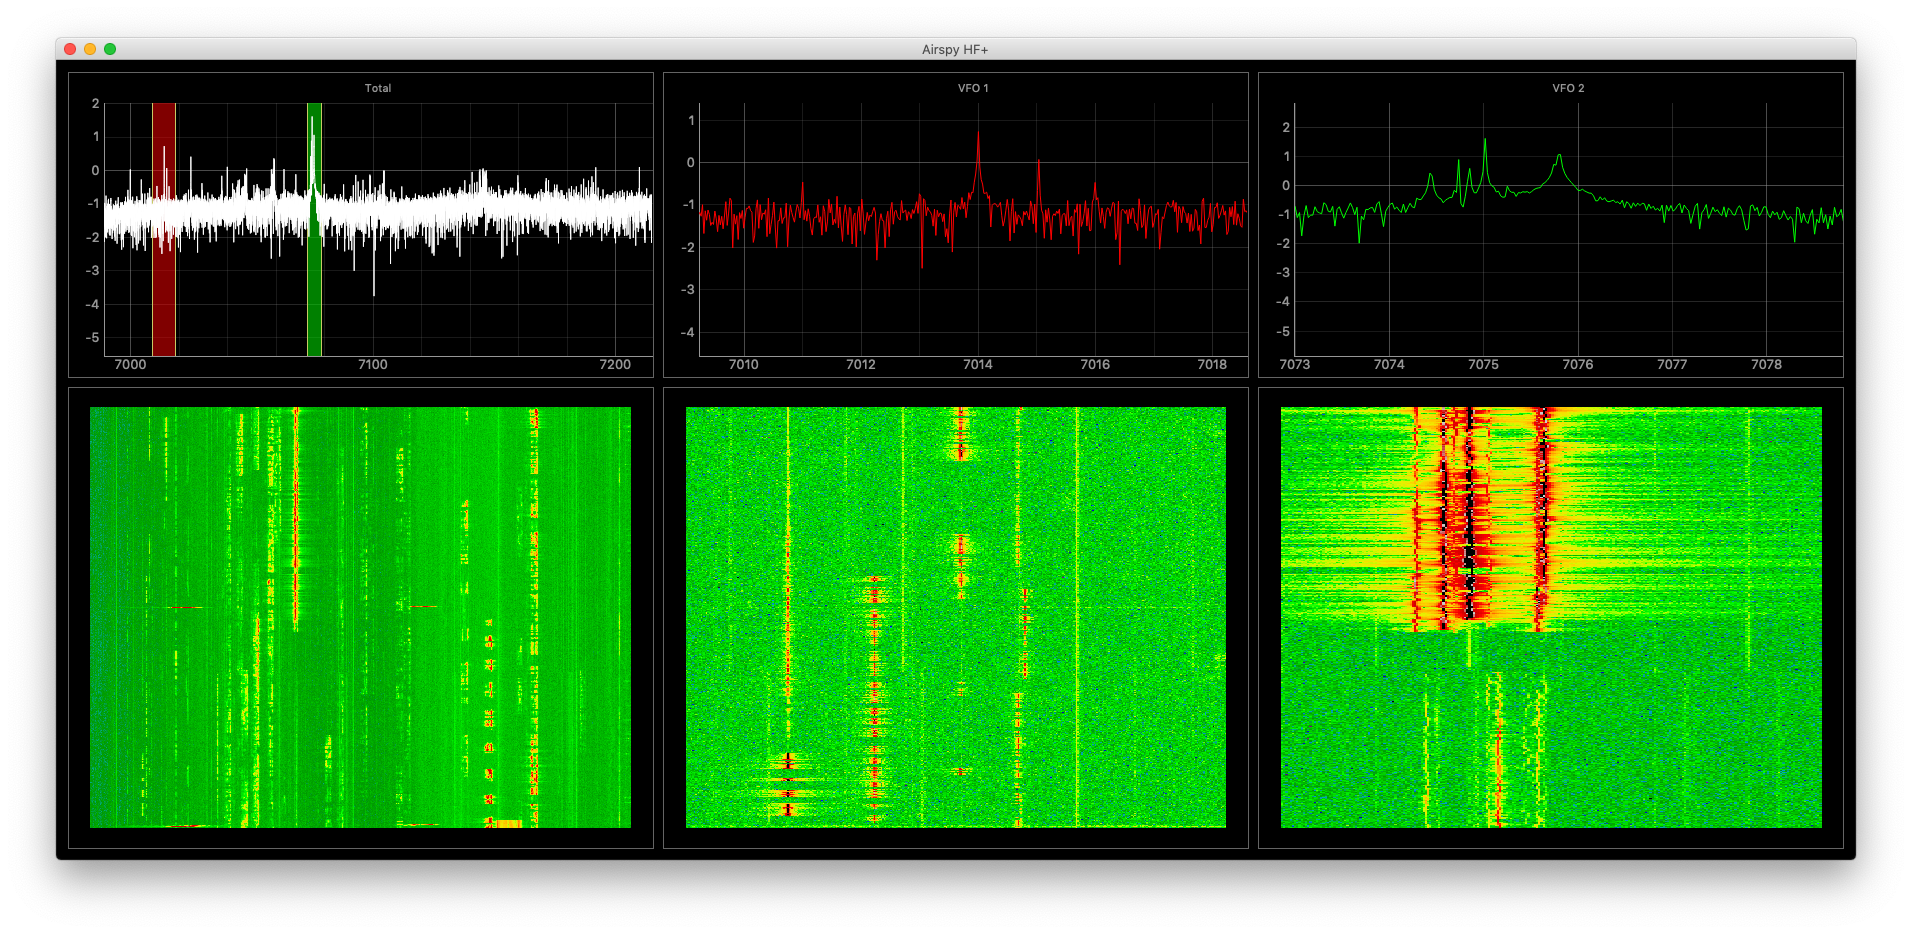
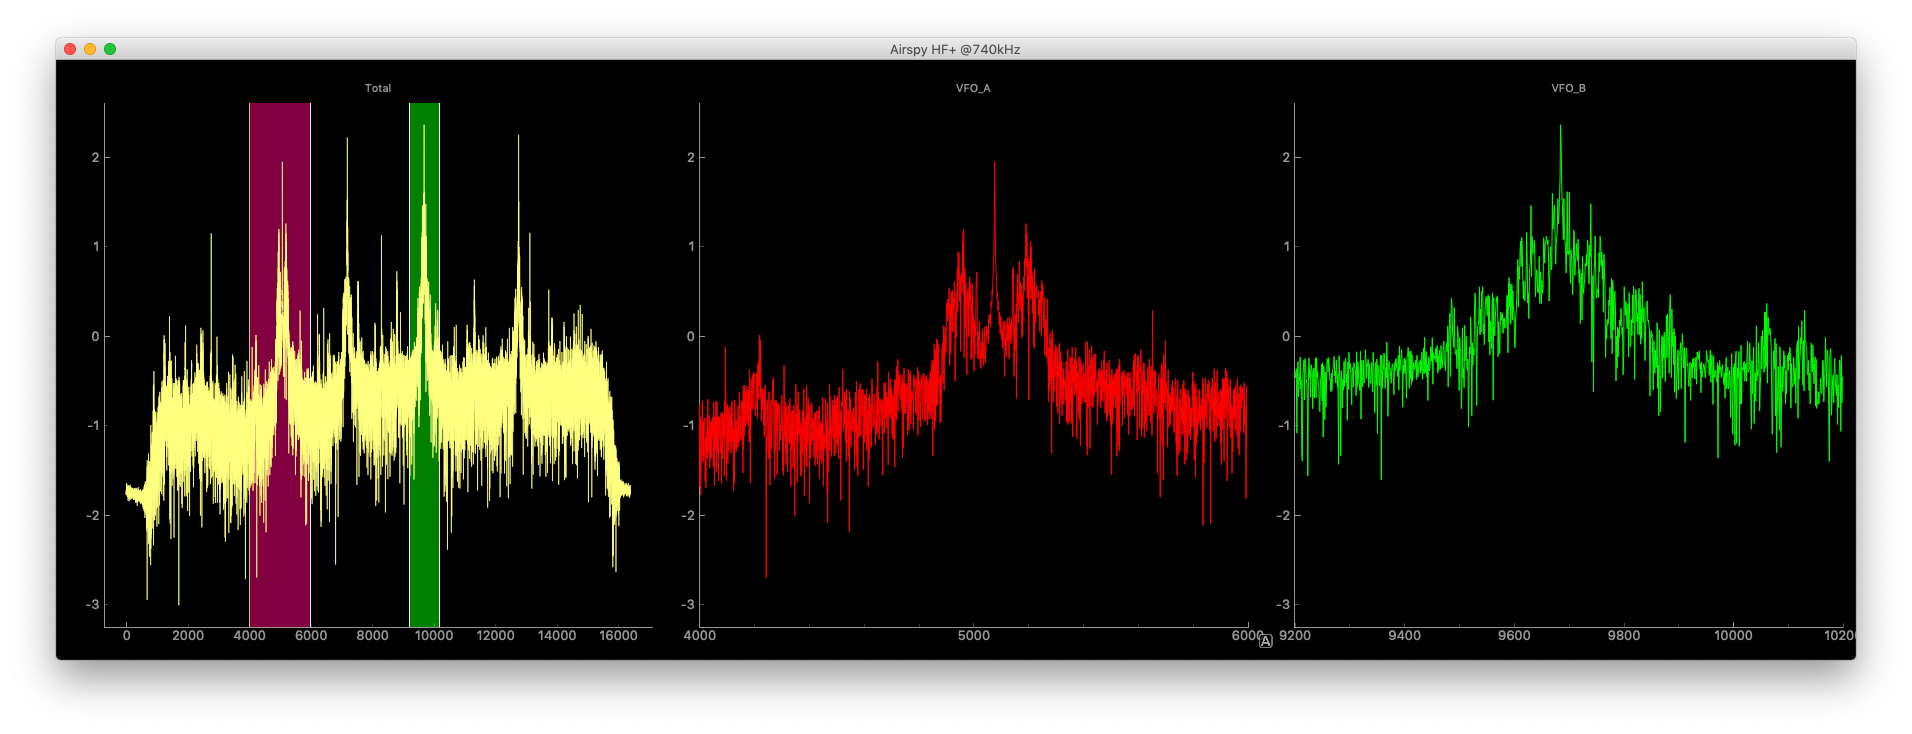
Dual watch, or as many watch as you wish.
Now, trying to demodulate a CW signal.
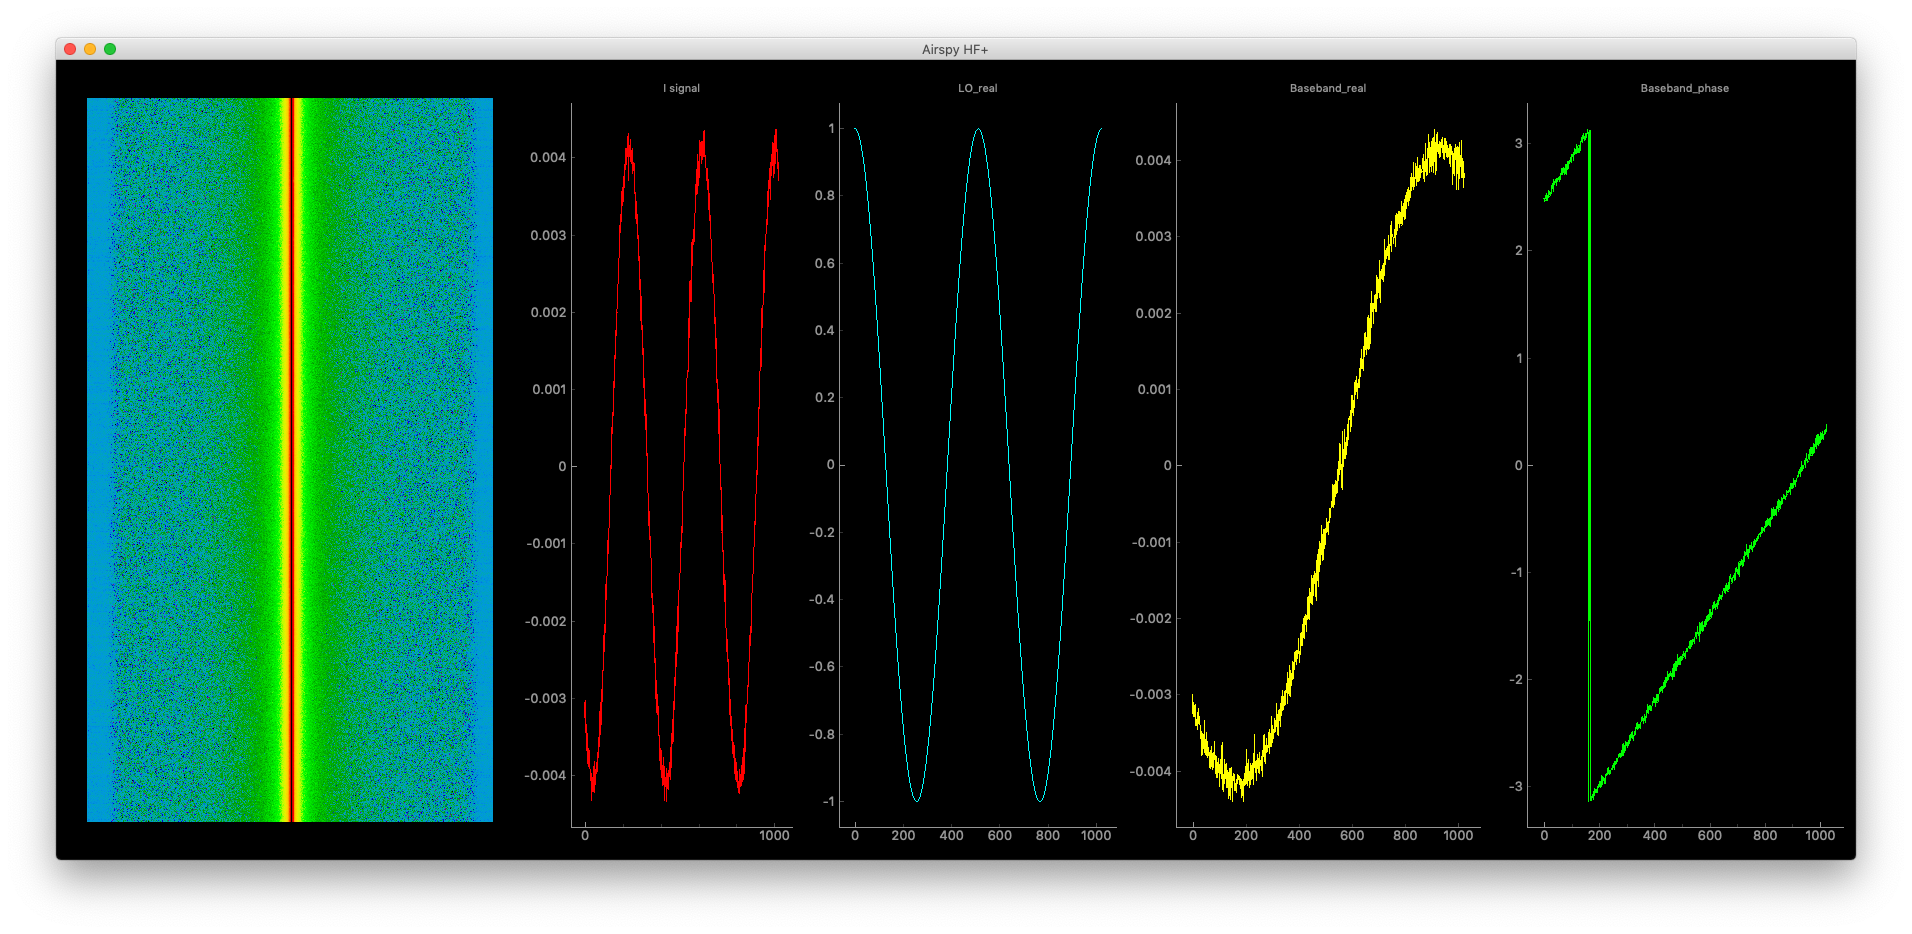
The LO frequency is a little bit too low.
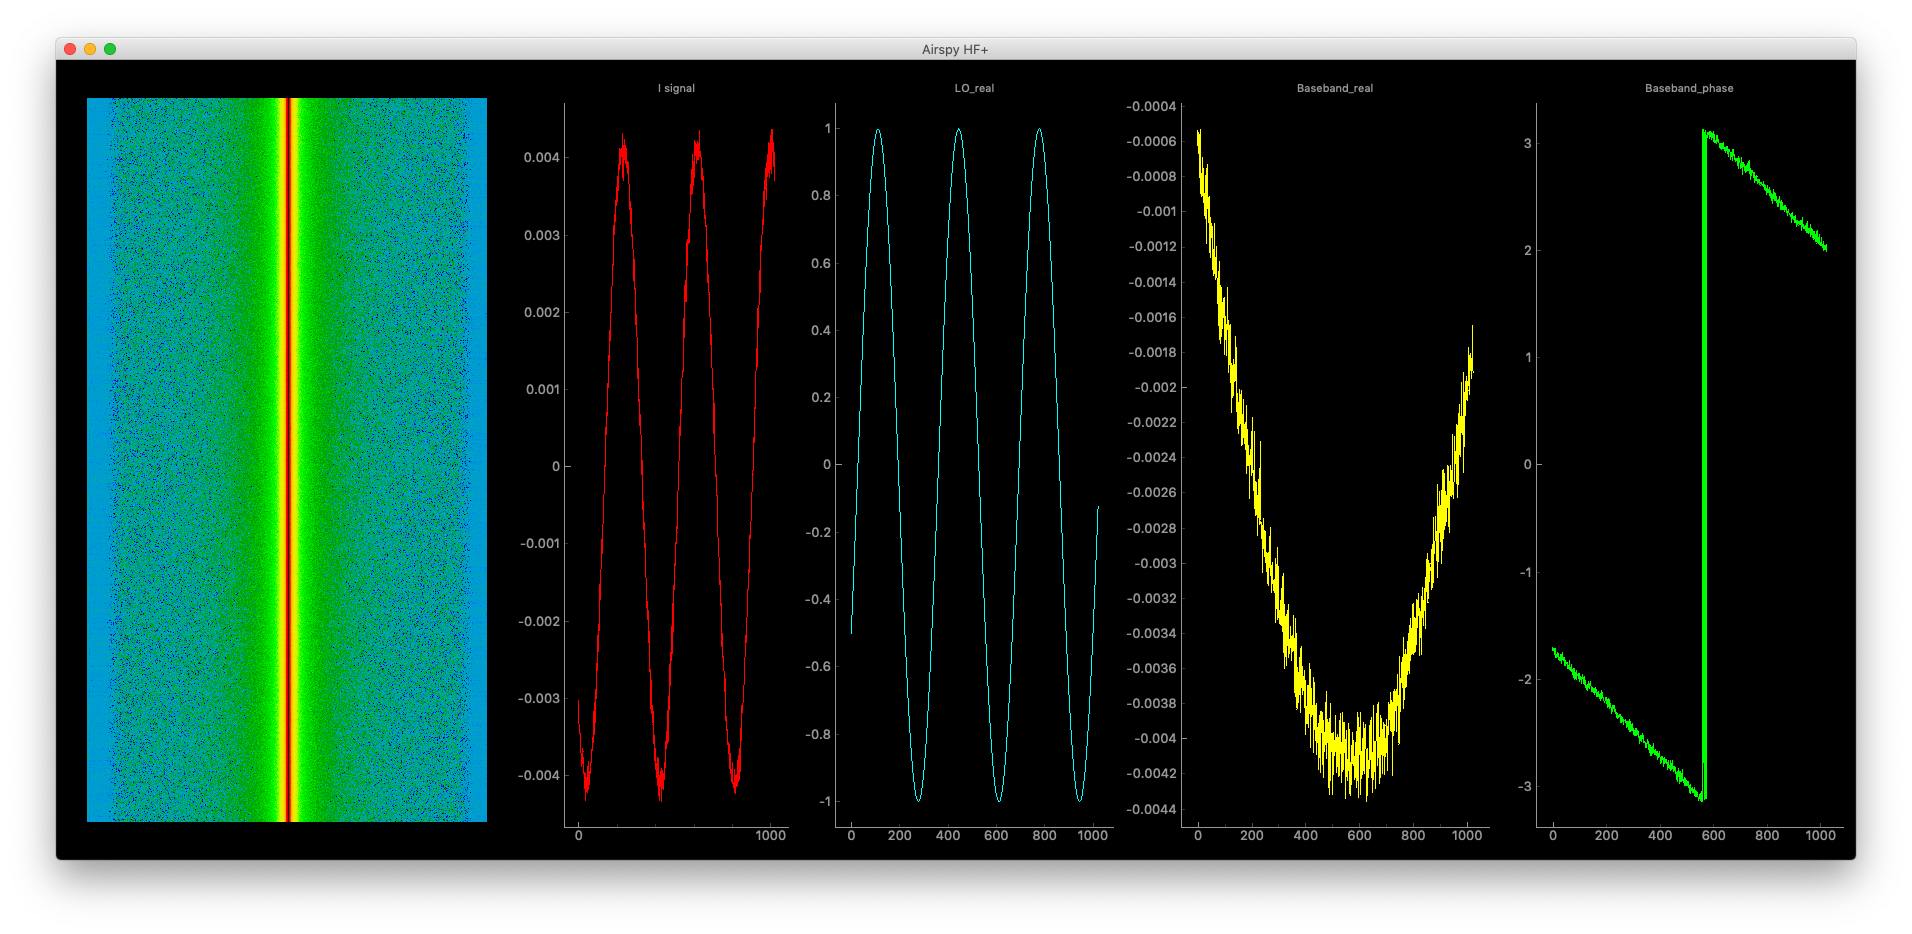
This time a little bit too high.
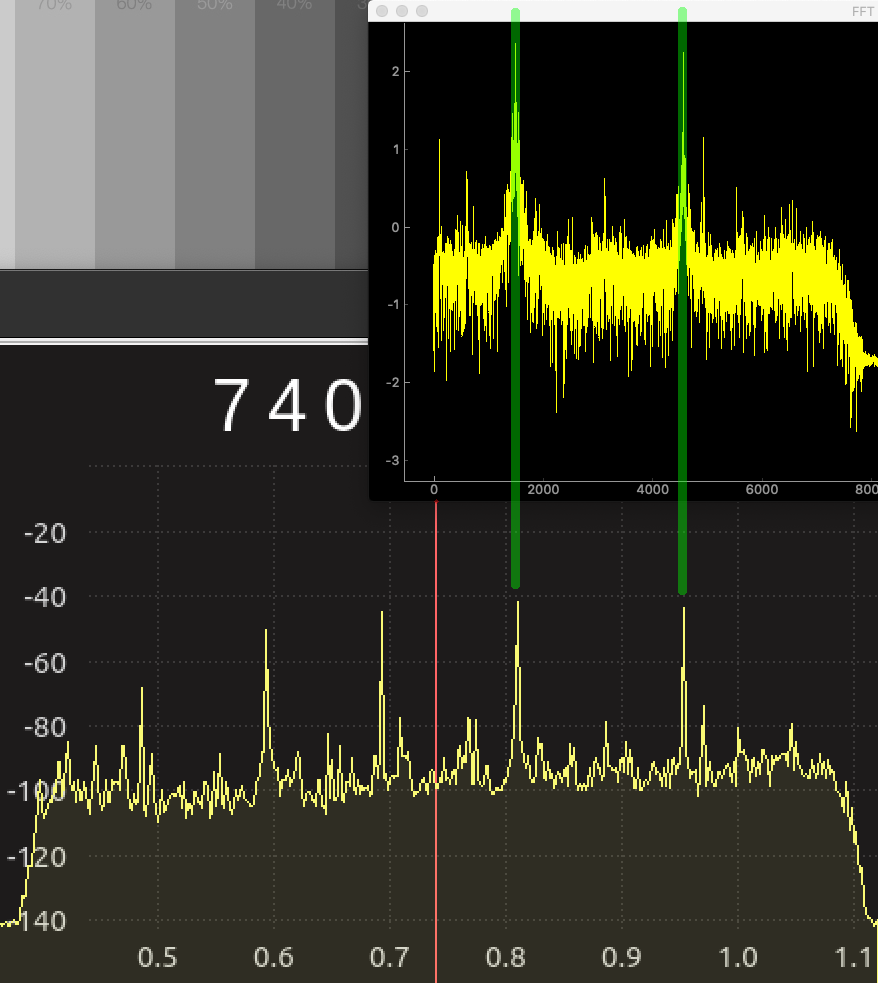
The center frequency is 7074kHz.
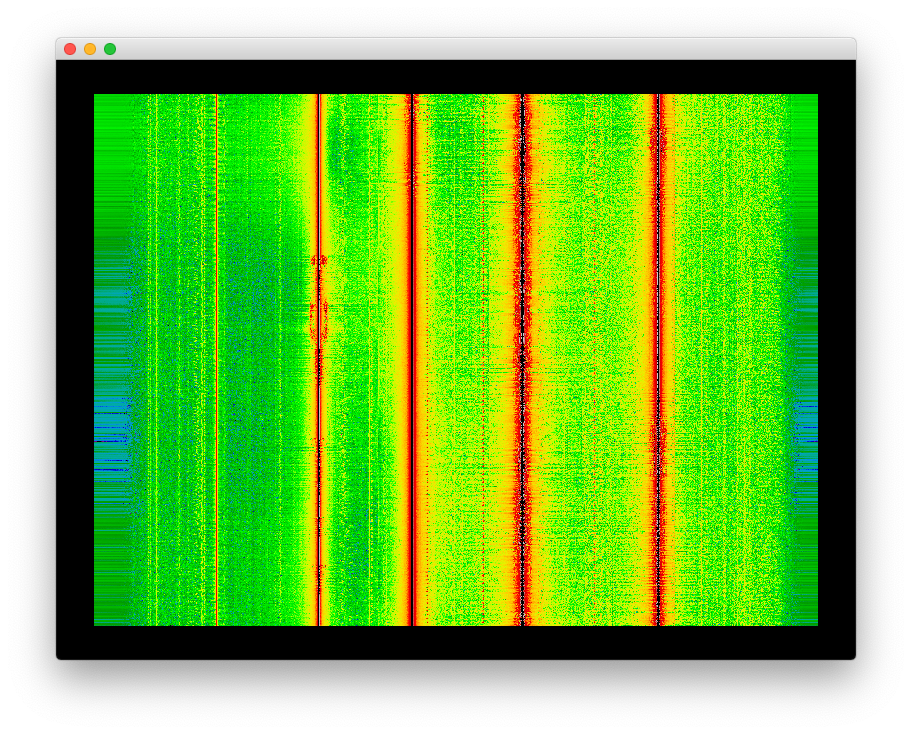
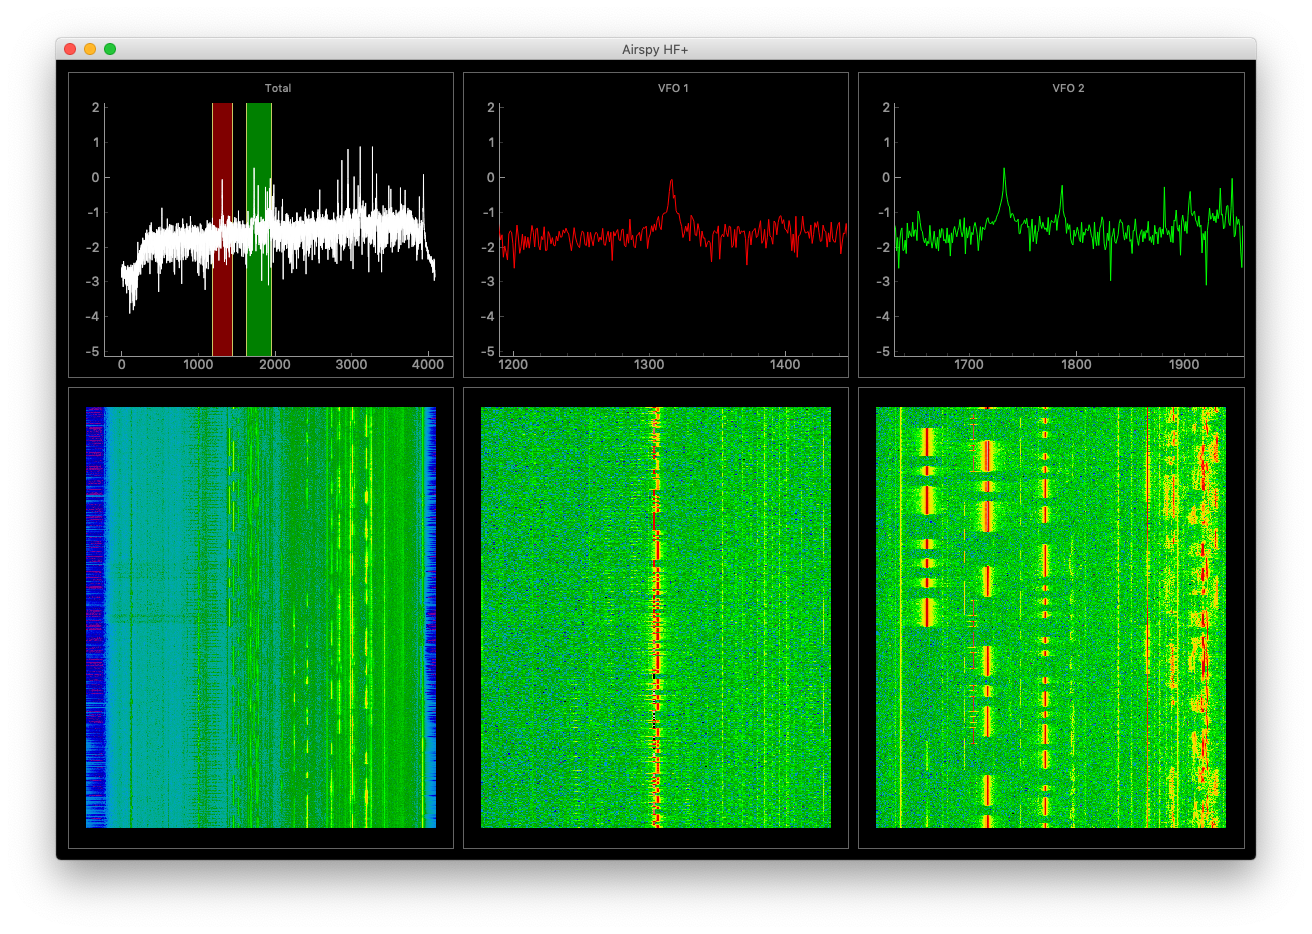
The center frequency is now 740kHz. You can see four AM stations.
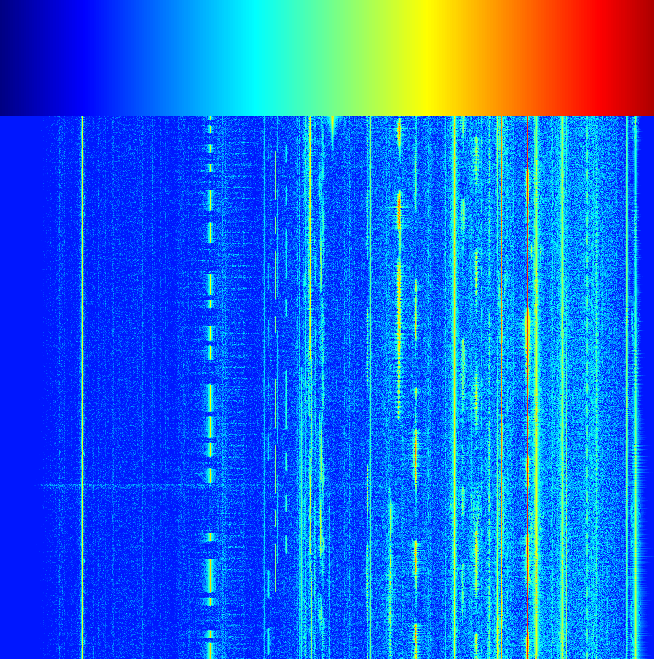
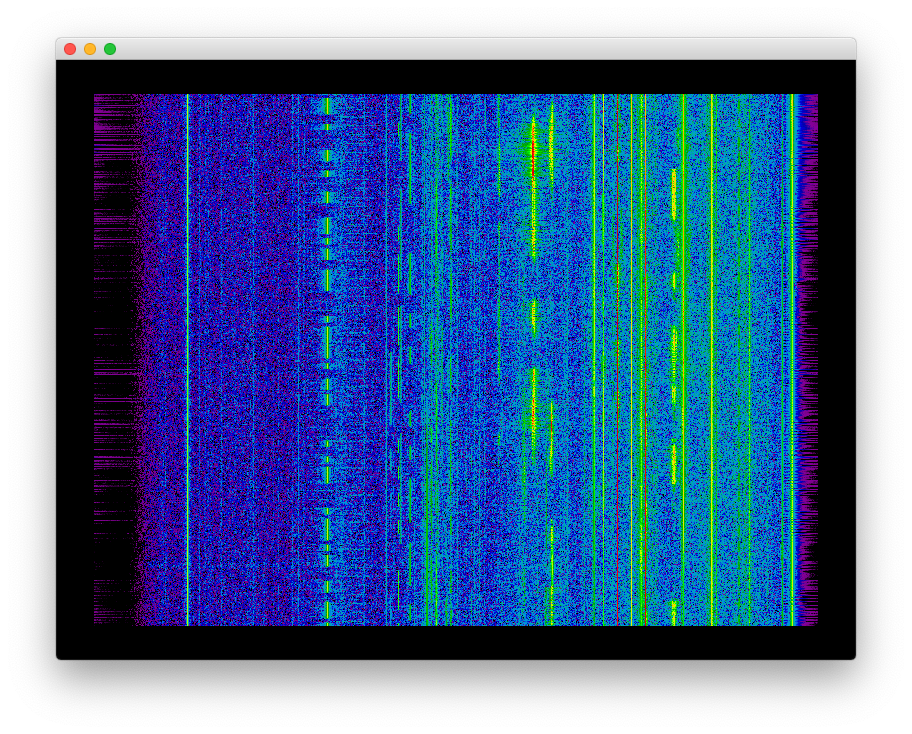
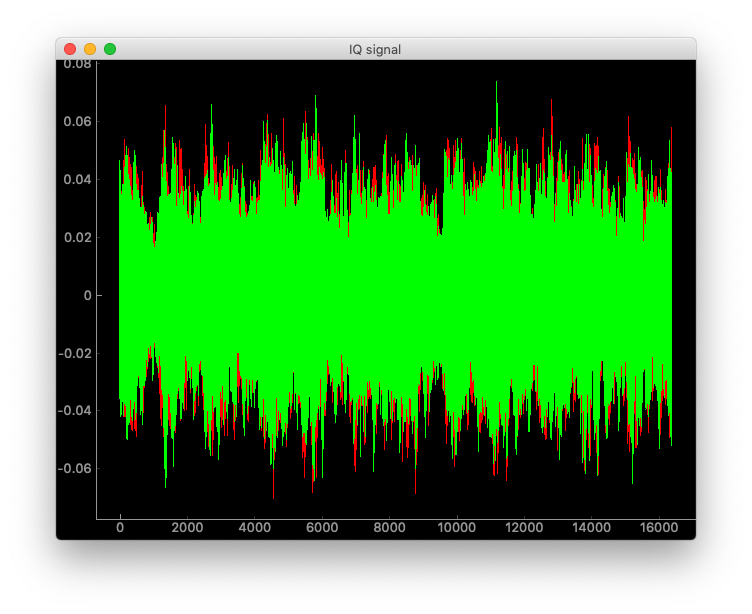
This is in psuedo-color.
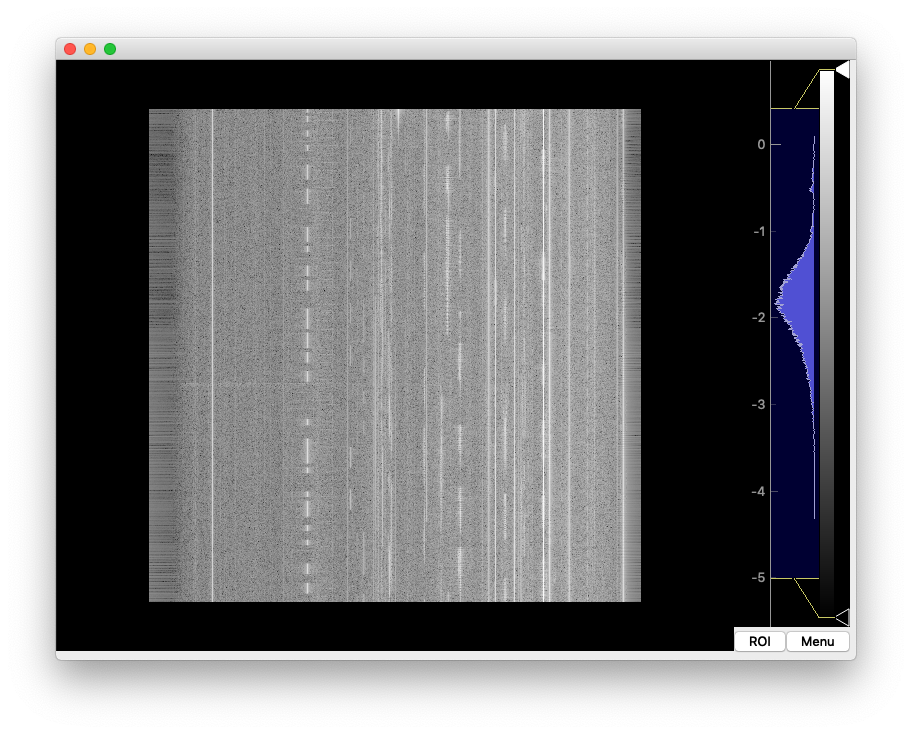
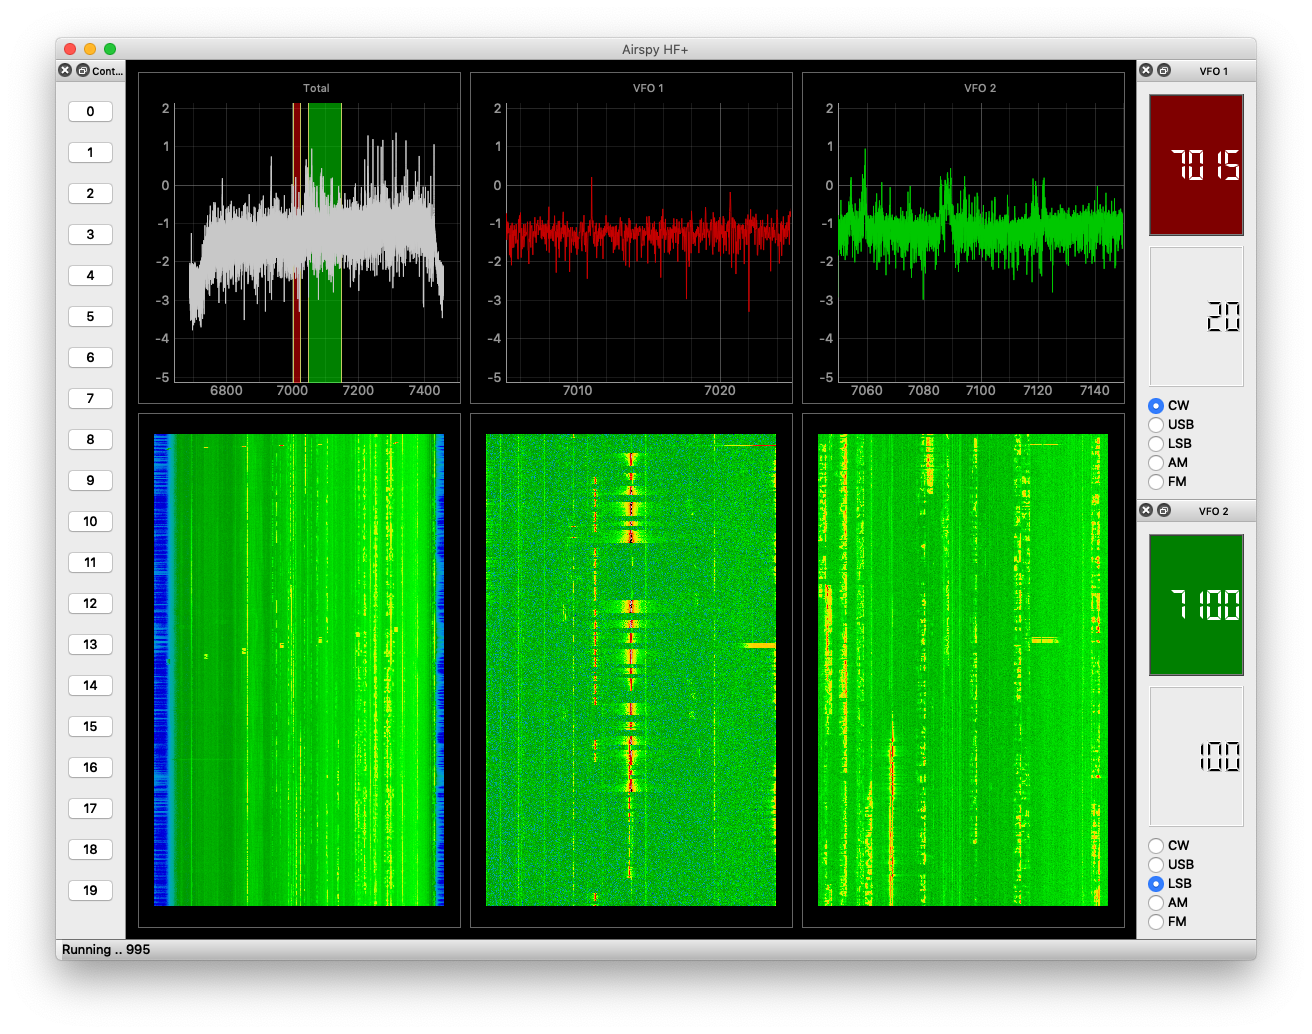
Draw a waterfall image for IQ signals.
Airspy HF+ Technical specifications:
Within the receiving band of 660kHz width, you can simultaneously tune in to as many signals as you wish.
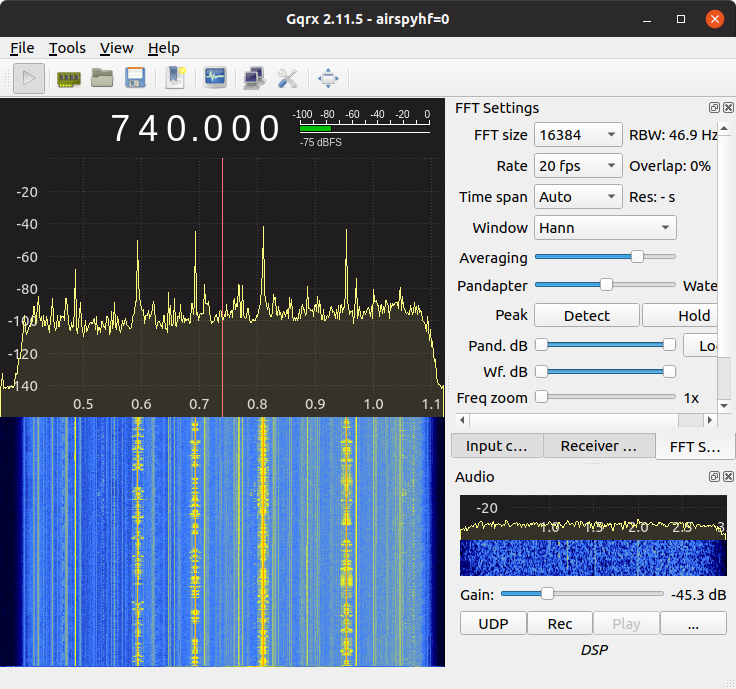
Listening to the AM band with Gqrx and airspyhf_rx.
user1@Asrock ~ % airspyhf_rx -z -d -r stdout -f 0.740 -m on > iq.bin
user1@Asrock ~ % python3 pyqtgraph_test2.py
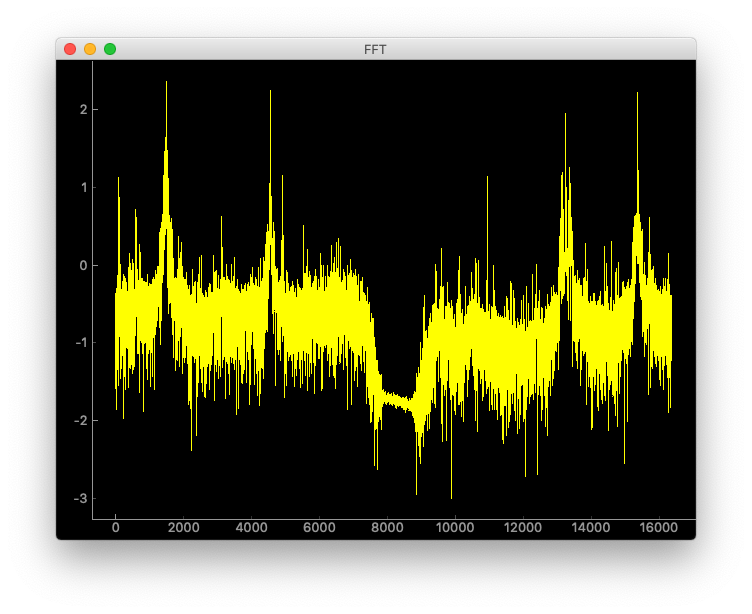
If you compare two graphs, they look almost the same?