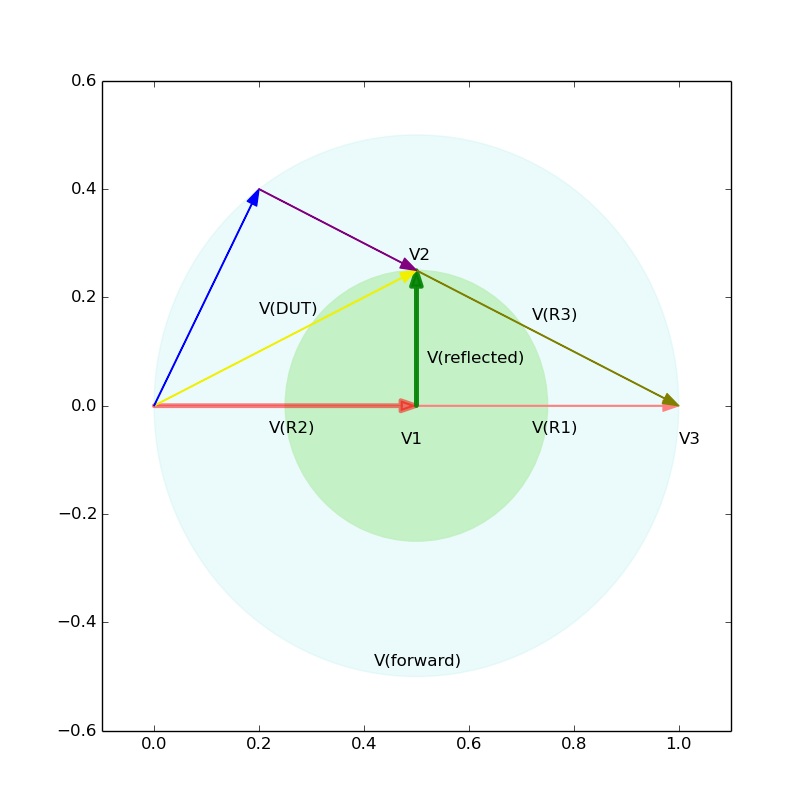
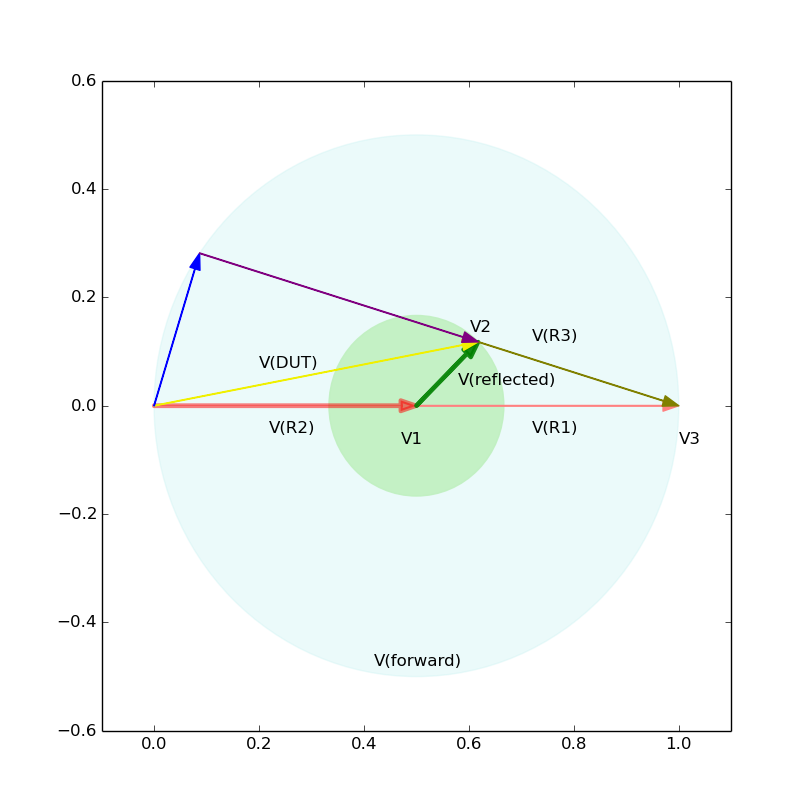
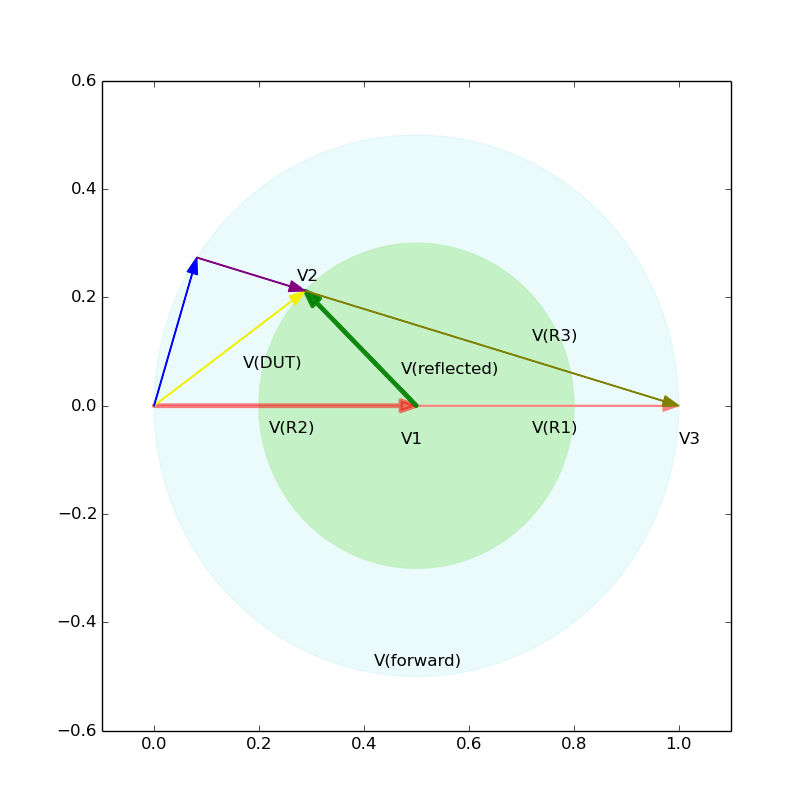
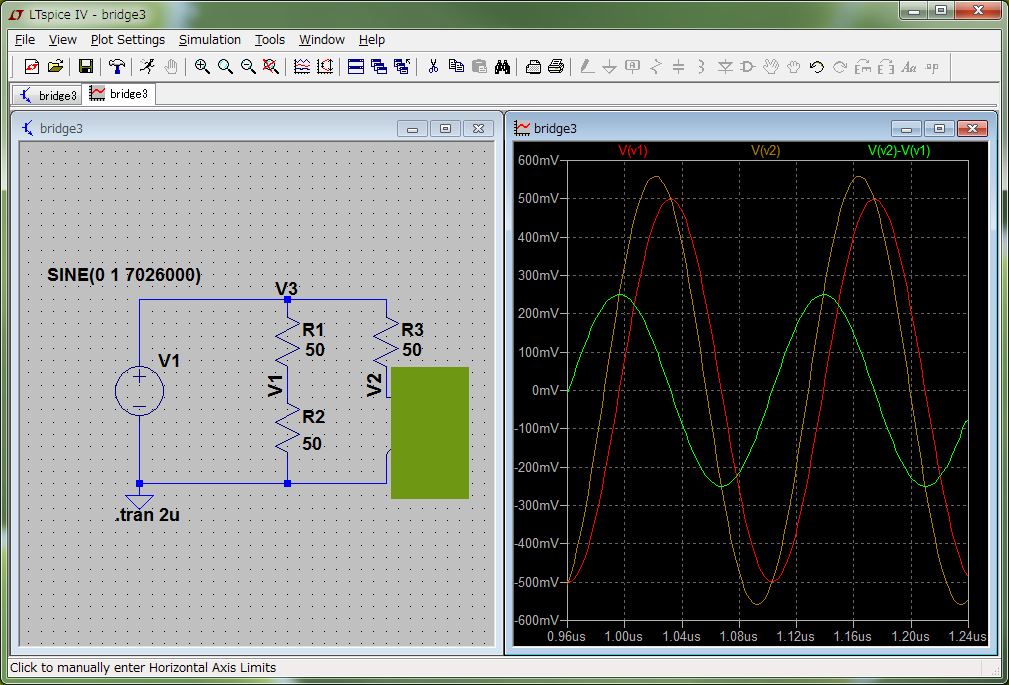
Now let us graphically obtain Z(DUT) for three cases. Note that the reflection coefficient, gamma, is a complex number defined as V(reflected)/V(forward). I forgot to annotate V(R2) as V(forward). Please see, for example, this figure.
This is the case in which abs(gamma)=1/2 and arg(gamma)=90 deg. We see graphically, or by measuring the length of each vector, that Z(DUT)=40 + j30 [ohm]. Note that since abs(gamma)=0.5, VSWR=(1+abs(gamma))/(1-abs(gamma))=3.
Next, this is the case abs(gamma)=1/3 and arg(gamma)=45 deg. Again, we see graphically that Z(DUT)=69.5 + j36.8 [ohm], and VSWR=(1+1/3)/(1-1/3)=2.
Finally, this is the case abs(gamma)=3/5 and arg(gamma)=135 deg. We see that Z(DUT)=14.5 + j19.2 [ohm], and VSWR=(1+3/5)/(1-3/5)=4.
Notice that the length of V(R3) differs in three figures, although the length corresponds to 50 [ohm] in each case.
Now, here is the fun part.
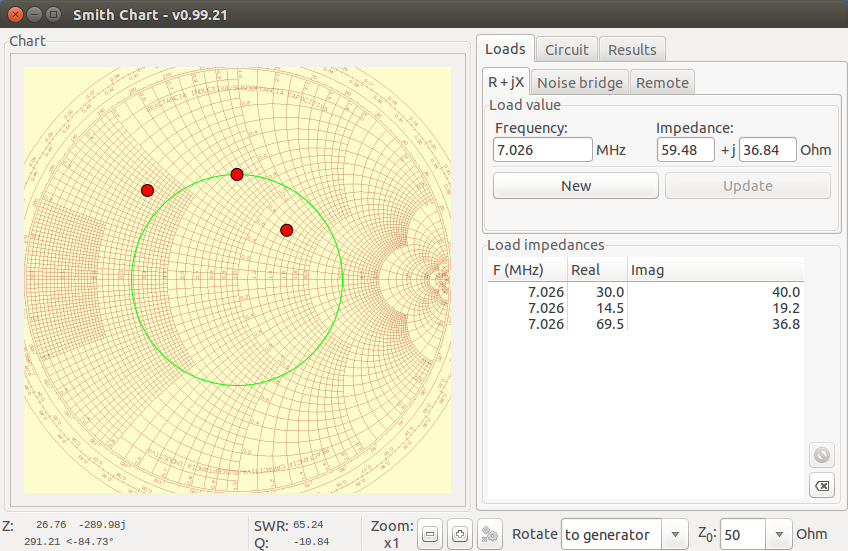
Let’s see the Smith Chart with three Lord impedances, which are the Z(DUT)s in the three cases. (Note the green circle is a SWR=3 circle.)
Do you see how these three red points in the Smith Chart relate to the three vector diagrams above? Yes, the red pionts are the end points of the vector V(reflected).
So if you observe V1 and V2 with your oscilloscope and draw a vector V(reflected), or equivalently a vector V(DUT) on a Smith Chart, you will directly get Z(DUT) just by reading a chart. Cool?

