
Now you understand that if you observe two waveforms V1 and V2 with your impedance bridge, you will obtain Z(DUT) after some simple calculations, which you can do it manually or with a short program as is shown in my previous post, Eureka.
But, how can you do it painlessly, assuming that you do not like calculations very much, by just drawing a vector diagram? Here is the answer, namely a graphical solution:
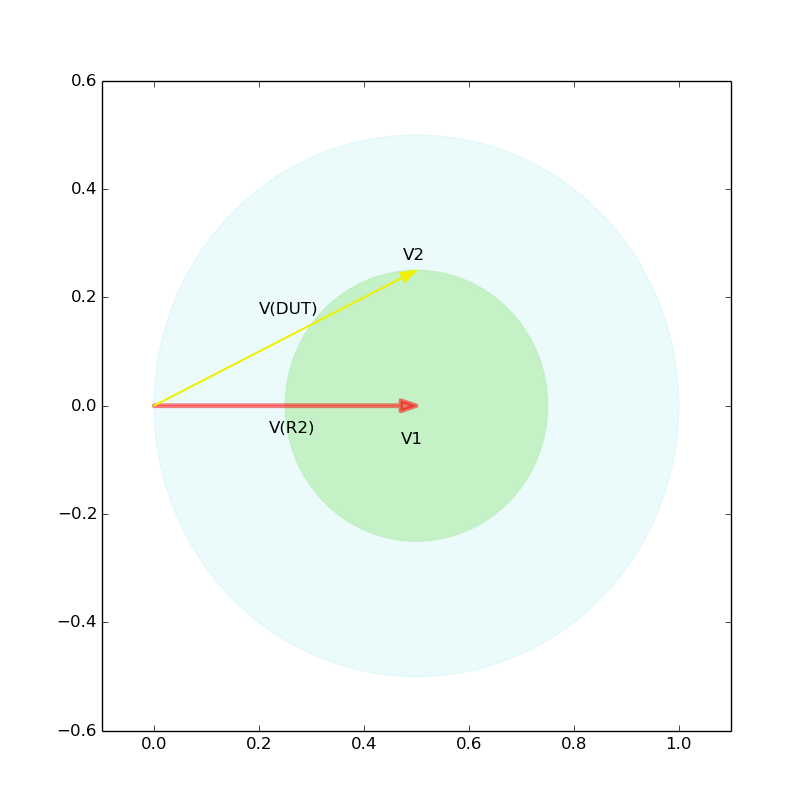
First, you draw two vectors V(R2) and V(DUT), which you observed as V1 and V2, respectively. In this example, V2/V1=1.118 and at V2 is advanced in relative to V1 with 26.56 deg. This is all the information you need to get Z(DUT), but you can add some more vectors to fully understand the situation with your bridge.
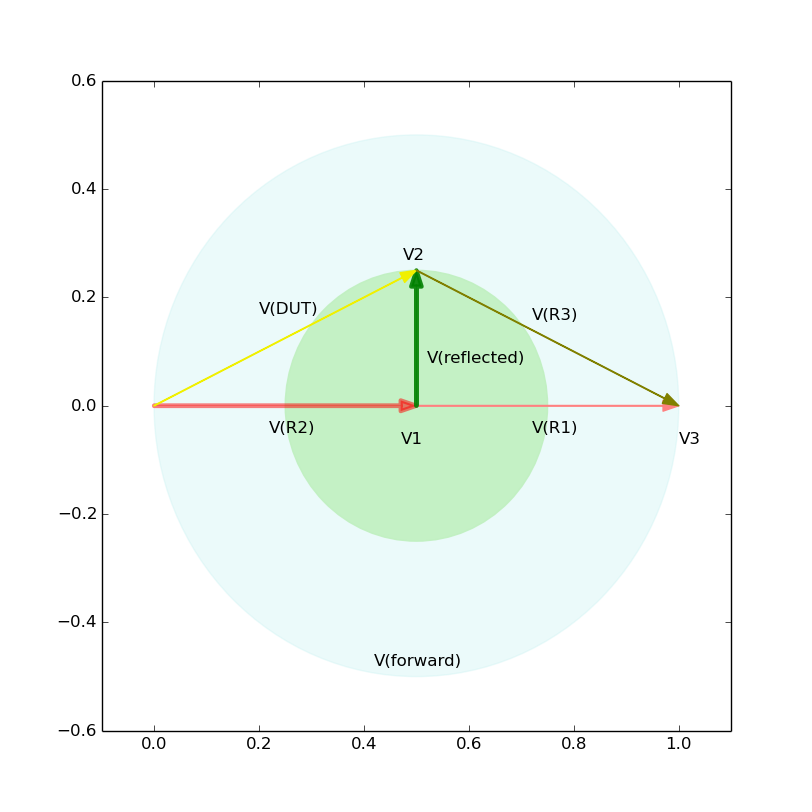
First, you will immediately notice that by symmetry of the diagram, the length of V(DUT) is equal to that of V(R3), and since R3=50 [ohm] and the same current goes through both the DUT and R3, abs(Z(DUT)) is also 50 [ohm], which means R^2+X^2=50 [ohm], where R and X are defined as Z(DUT)=R+jX.
Now, the next step is to determine R and X.
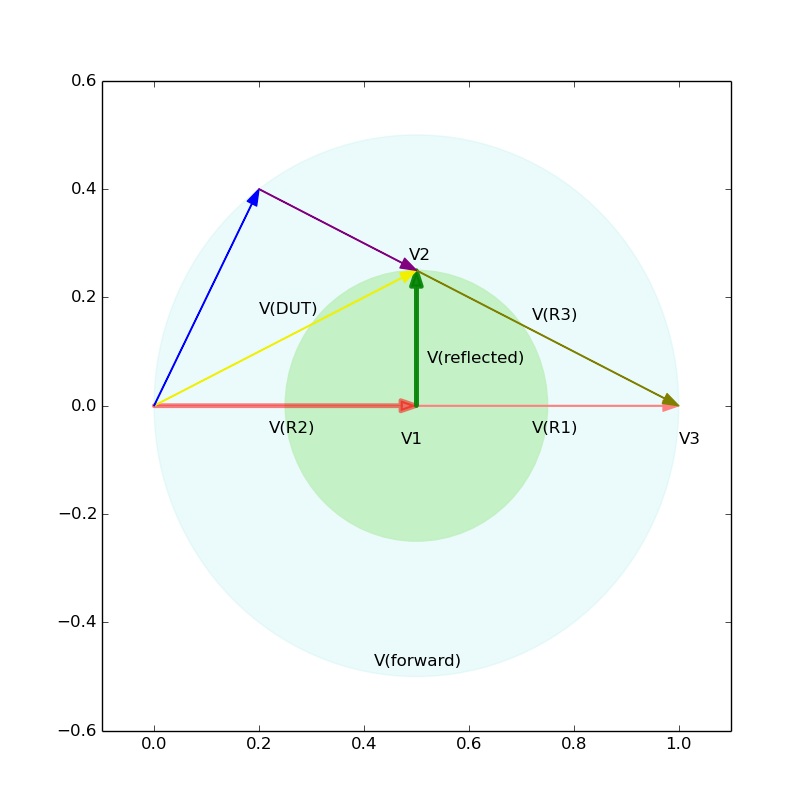
For that, you will decompose the vector V(DUT) into two orthogonal vectors, the blue and the purple, by extending the vector V(R3) until it hits the outer circle. Then the length of the blue vector tells you how large X is, and the purple, R.
Noting that R3 is 50 [ohm], you will know that R (purple) is 30 [ohm] and X (blue) is 40 [ohm]