Impedance Measurement and Curve Fitting (2)

root5

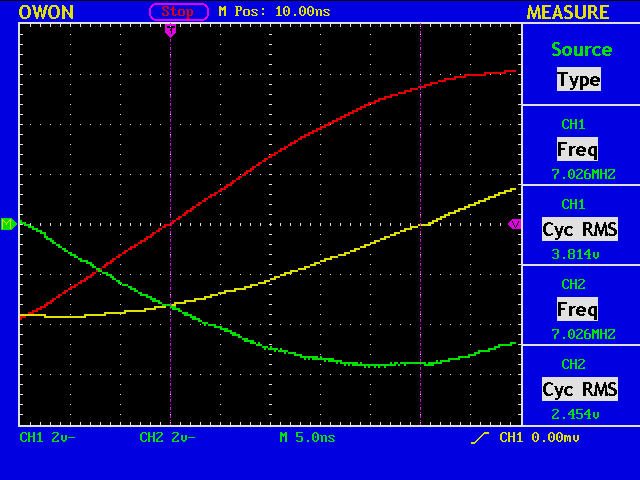
Now let’s try to measure the impedance of my dipole antenna. The figure shows the reference signal in red and the signal across the antenna in yellow. If the impedance of the dipole antenna is exactly 50 ohm, the two signals should be the same.

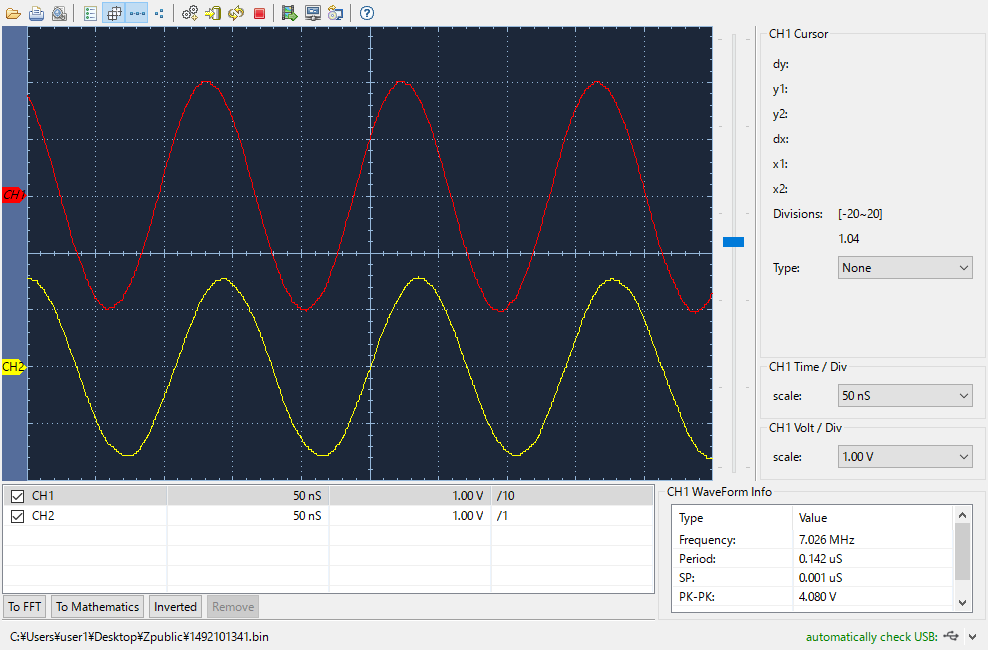
% head -15 owondata.txt
Save Time: 2016-09-11 13:27:26
Units:(mV)
                           CH1            CH2
Frequency:           7.026 MHz      7.042 MHz
Period:               0.142 uS       0.142 uS
SP:                   0.001 uS       0.001 uS
PK-PK:                 4.080 V        3.200 V

1              0.000                  1760.00        1560.00
2              0.001                  1760.00        1560.00
3              0.001                  1720.00        1560.00
4              0.002                  1720.00        1560.00

A text file obtained from the oscilloscope, OWON PDS 5022S, is fed into an AWK one-liner before being processed by a program written in ROOT.

% cat owondata.txt | awk 'NR>8 {print $1, $3}' >owondata_ch1.txt
% cat owondata.txt | awk 'NR>8 {print $1, $4}' >owondata_ch2.txt
// file name = mytest5.cc
{
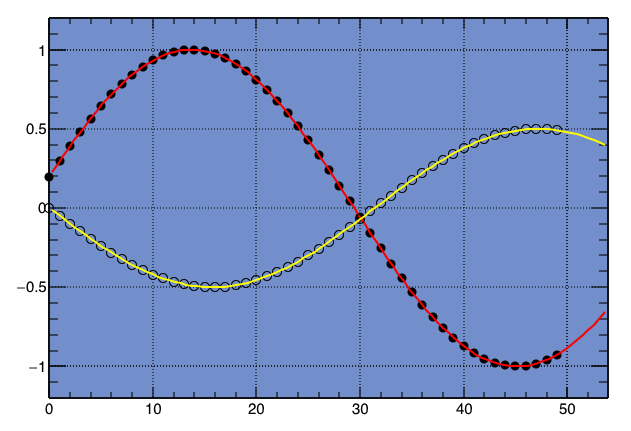
  TGraph *g = new TGraph("owondata_ch1.dat");
  g->SetMarkerStyle( 20 );
  g->SetMarkerSize( 0.5 );
  g->Draw("AP");
  TF1 *f1 = new TF1("f1", "[0]*sin([1]*x+[2])+[3]"); 
  f1->SetParameter(0, 2000.0);
  f1->SetParameter(1, 0.022);
  f1->SetParameter(2, 0.0);
  f1->SetParameter(3, 0.0);
  f1->SetLineColor(kRed);
  g->Fit(f1);

  TGraph *h = new TGraph("owondata_ch2.dat");
  h->SetMarkerStyle( 24 );
  h->SetMarkerSize( 0.5 );
  h->Draw("P");
  TF1 *f2 = new TF1("f2", "[0]*sin([1]*x+[2])+[3]");
  f2->SetParameter(0, 2000.0);
  f2->SetParameter(1, 0.022);
  f2->SetParameter(2, 0.0);
  f2->SetParameter(3, 0.0);
  f2->SetLineColor(kYellow);
  h->Fit(f2);
}

root4

% root mytest5.cc

****************************************
Minimizer is Minuit / Migrad
Chi2                      =       536853
NDf                       =          996
Edm                       =  7.63442e-09
NCalls                    =          148
p0                        =      2001.67   +/-   1.04511     
p1                        =    0.0220756   +/-   1.82267e-06 
p2                        =      2.03624   +/-   0.00102561  
p3                        =     -12.2567   +/-   0.749788    

****************************************
Minimizer is Minuit / Migrad
Chi2                      =       459226
NDf                       =          996
Edm                       =  8.91283e-08
NCalls                    =          128
p0                        =      1558.13   +/-   0.960465    
p1                        =    0.0220847   +/-   2.15852e-06 
p2                        =      1.50439   +/-   0.00124773  
p3                        =     -14.2113   +/-   0.68435     

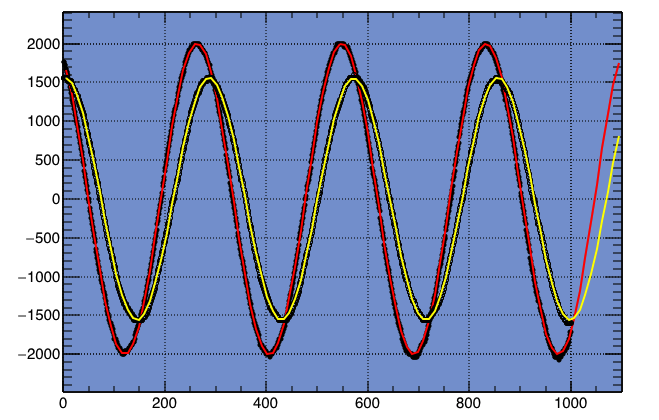
The parameters p0 and p2 are the amplitude and the phase, respectively, so the amplitude ratio is 1558.13/2001.67=0.778415, and the phase difference is 1.50439-2.03624=-0.531850[rad]=-30.4728[deg].

Impedance Measurement and Curve Fitting

root3

You can measure the impedance of the device under test (DUT), such as your antennas, by observing the amplitude and the phase of a sinusoid applied to the device. Of course, the measurement should be relative to some reference, so practically you need to observe the two signals at the same time.

owon7MHz20mOpen

For example, in this figure, you wish to measure the amplitude and the phase of the signal in yellow using the signal in red as a reference.

See my page Antenna for the detailed discussions.

Actually measurement can be done in various ways, such as moving a cursor manually between the two zero-cross points to know the phase difference. Here is my trial to see what happens if I use the curve fitting functions provided by ROOT

A test data set is generated with a short C program, shown as black and white circles in the figure, and the curves in red and in yellow are the obtained results.

% root -x mytest4.cc

****************************************
Minimizer is Minuit / Migrad
Chi2                      =  2.09673e-08
NDf                       =           47
Edm                       =   4.1926e-08
NCalls                    =          121
p0                        =      1.00001   +/-   4.08054e-06 
p1                        =     0.100001   +/-   3.45297e-07 
p2                        =      6.48313   +/-   8.9754e-06  

****************************************
Minimizer is Minuit / Migrad
Chi2                      =   9.1854e-10
NDf                       =           47
Edm                       =  1.83714e-09
NCalls                    =           70
p0                        =     0.500002   +/-   8.8495e-07  
p1                        =          0.1   +/-   1.29983e-07 
p2                        =      3.13999   +/-   3.40443e-06 
root [1] 

The parameters p0, p1, and p2 are the amplitude, the frequency, and the phase.

// file name = mytest4.cc
{
  TGraph *g = new TGraph("myfile4a.dat");
  g->SetMarkerStyle( 20 );
  g->SetMarkerSize( 1.0 );
  g->Draw("AP");
  TF1 *f1 = new TF1("f1", "[0]*sin([1]*x+[2])");
  f1->SetParameter(0, 0.25);
  f1->SetParameter(1, 0.11);
  f1->SetParameter(2, 3.14+0.2);
  g->Fit(f1);
  
  TGraph *h = new TGraph("myfile4b.dat");
  h->SetMarkerStyle( 24 );
  h->SetMarkerSize( 1.0 );
  h->Draw("P"); 
  TF1 *f2 = new TF1("f2", "[0]*sin([1]*x+[2])");
  f2->SetParameter(0, 0.25);
  f2->SetParameter(1, 0.11);
  f2->SetParameter(2, 3.14+0.2);
  h->Fit(f2);
}