
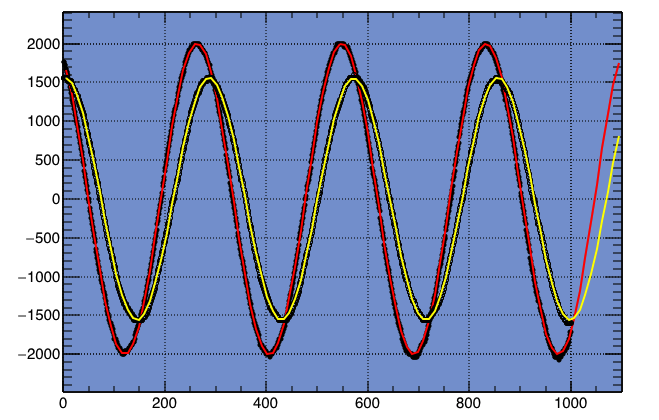
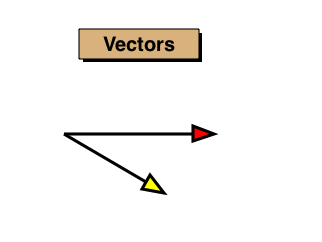
In the figure, two signals are represented as vectors. The red one shows the reference signal, and the yellow one the signal across the DUT. Actually, the two vectors are rotating counterclockwise (by convention) with the source signal frequency of 7026kHz, but we are only interested in relative relations of the vectors.
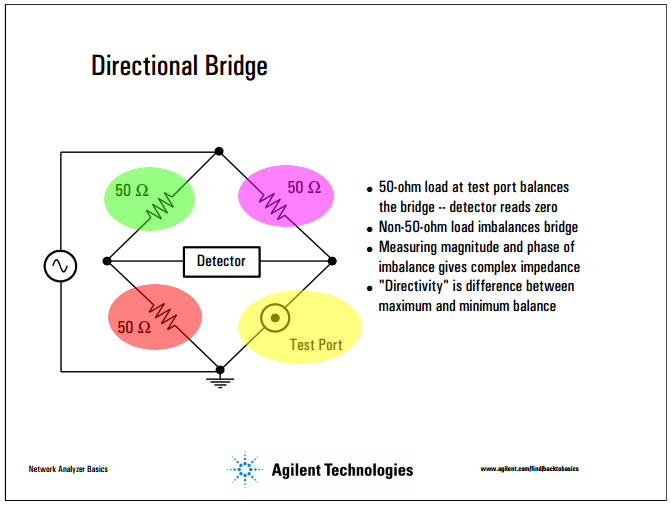
Now, how do we know the impedance of the DUT? Recalling the measuring circuit, we can add two more vectors in the figure.
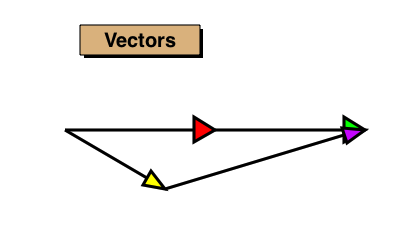
Note that the red and the green vectors are the same, because the two 50 ohm resistors are in series. The purple vector is obtained as a difference between twice the red vector and the yellow vector.