Data sets in R are most often stored in data frames. A data frame is a two dimensional data structure, with each row representing a case and each column reresenting a variable. You can generate a data frame, for example, from vectors as in the following way, where each vector represents a column.
> name    <- c("Alpha", "Bravo", "Charlie", "Delta")
> weight  <- c(31.0, 47.2, 69.5, 99.8)
> price   <- c(9.2, 13.7, 21.4, 38.5)
> example <- data.frame(name, weight, price)
> example
     name weight price
1   Alpha   31.0   9.2
2   Bravo   47.2  13.7
3 Charlie   69.5  21.4
4   Delta   99.8  38.5
Once you have a data frame, it is a relatively simple task to analyze the data and to draw graphs of various types.
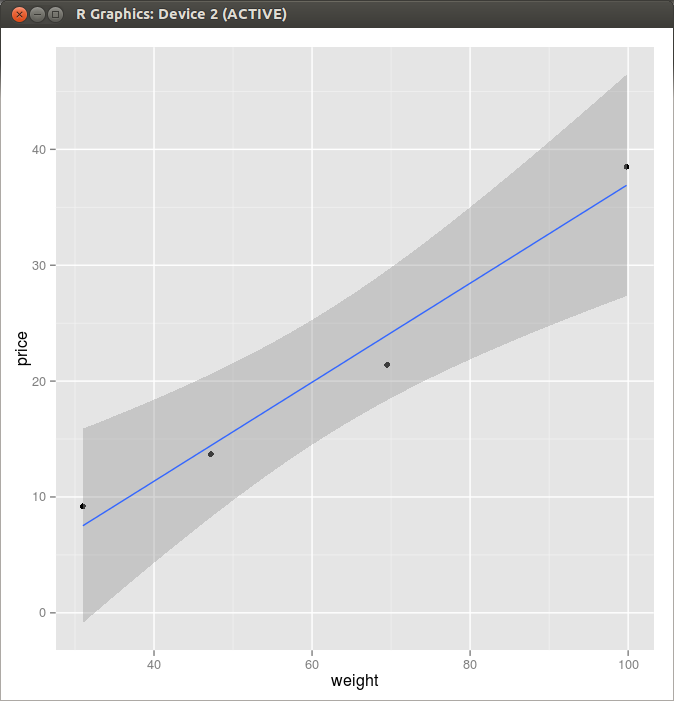
> graph <- ggplot(example, aes(x=weight, y=price))
> graph + geom_point() + stat_smooth(method=lm)
 Figure 1. Scatter Plot and a Linear Regression Line
        letter_space      11688          0
                 dot        510          0
       element_space        265          0
                 dot        533          1
       element_space        341          0
                 dot        511          2
       element_space        333          0
                 dot        499          3
        letter_space       1451          0
                 dot        541          0
       element_space        530          0
                dash       1647          0
       element_space        281          0
                 dot        505          1
        letter_space       2539          0
           (853 more lines deleted..)
Here is a first part of the output from “myprog” which reads a file containing Morse code that starts with “HR HR” by JO1FYC.
[1] http://homepage2.nifty.com/jo1fyc/sound/20051010_nikki-32.mp3
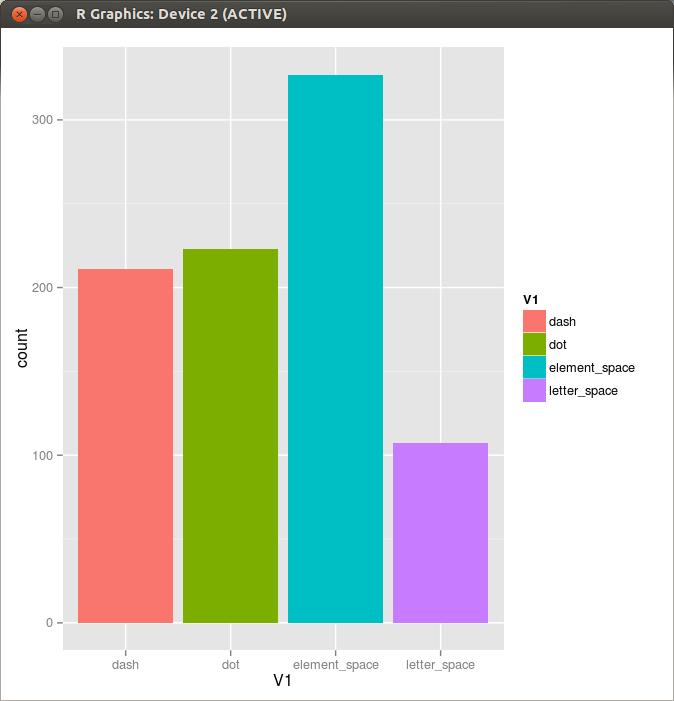
This is a text file and readily loaded into R by using read.table().
> mydata <-read.table("20051010_nikki-32_8kHz.aaa", header=FALSE)
> ggplot(mydata, aes(x=V1, fill=V1)) + geom_histogram()

