
It seems that the duration of dot cycle is almost constant except for the last few seconds. So I extracted a “nice part” of the dot and space duration data from the originals by discarding the first ten and the last sixty-two points, and tried to find the line of best fit by applying a linear model.
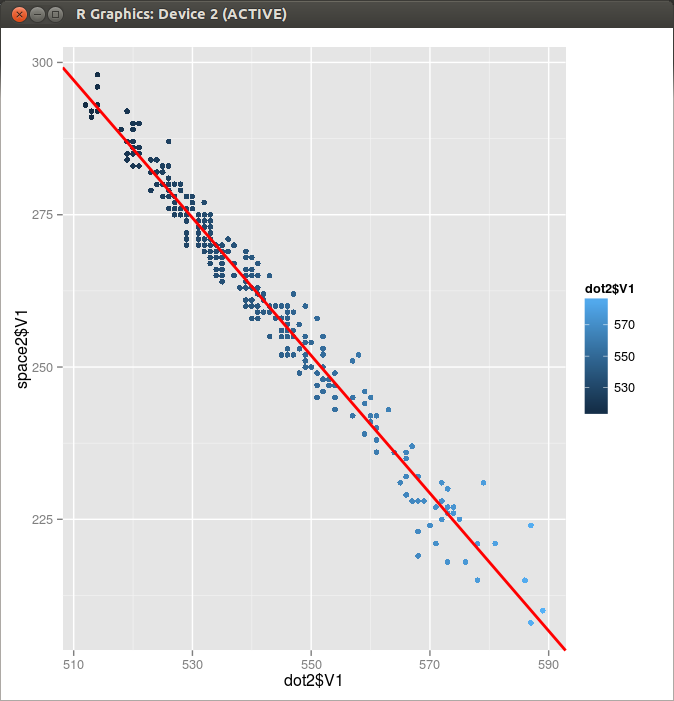
Figure 1. Dot and Space pair in a Single Dot Cycle
> dot2   <- read.table("BK2.dot"  ,header=FALSE)
> space2 <- read.table("BK2.space",header=FALSE)
> res=lm(space2$V1~dot2$V1)
> res

Call:
lm(formula = space2$V1 ~ dot2$V1)

Coefficients:
(Intercept)      dot2$V1
     873.38        -1.13

> p <- qplot(dot2$V1,space2$V1,color=dot2$V1)+geom_point(shape=23,size=1)
> p+ geom_abline(intercept=873.38, slope=-1.13, colour="red", size=1)