
The position (d1) and the length (d2) of the stub are the same as before, but the overall arrangement is modified to avoid cable spaghetti, which resulted in a slightly better match.
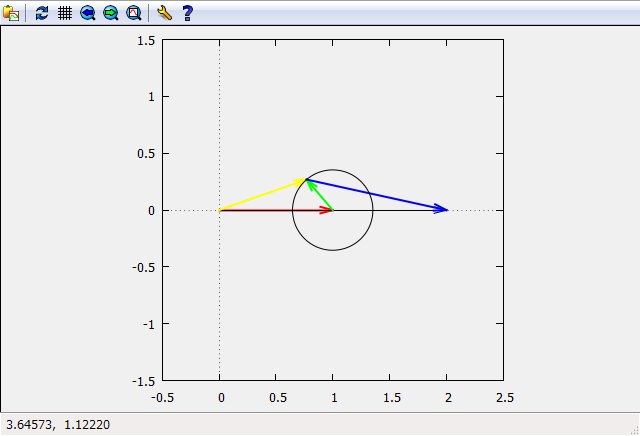
The green arc in the Smith chart corresponds to the d1 in the first figure, and the orange arc to the d2. By adjusting both parameters, any antenna radiation impedance, Zant, can be perfectly matched, which of course as far as a single frequency is concerned.
gnuplot> load "gnuplot1.txt"
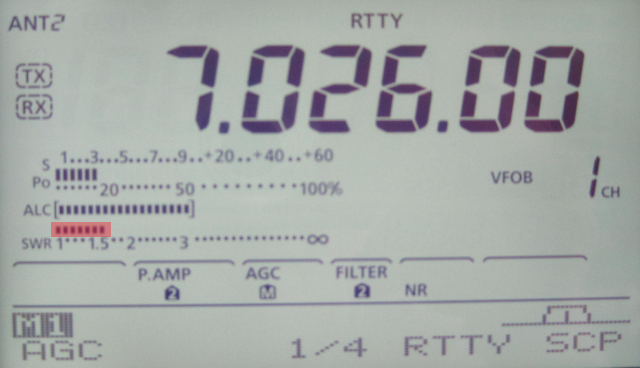
Freq [MHz]=7.026
V1=2.925
V2=2.386
Cursor 1=7.6e-009
Cursor 2=4.96e-008
vratio=0.815726495726496
phase1 [deg]=19.223136
phase2 [deg]=125.456256
abs(gamma)=0.35344142063807
swr=2.09330053585205
cz={27.6149176604425, 16.9509508914556}
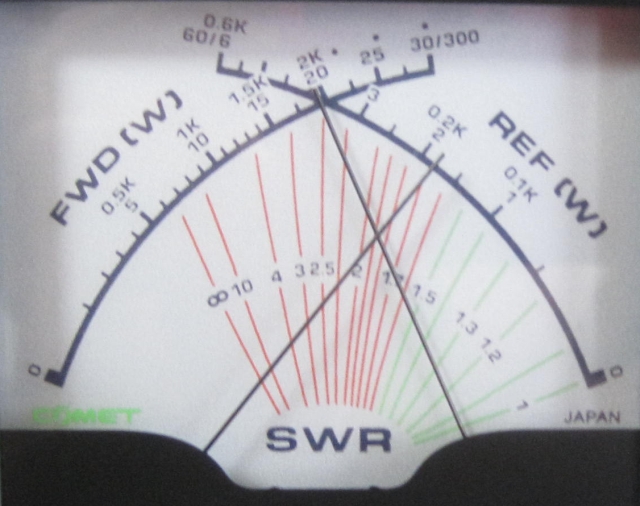
Changing the frequency between 7001kHz and 7060kHz, the following graph is obtained. The VSWR values are computed by measuring the forward and the reflected power with CMX-200.
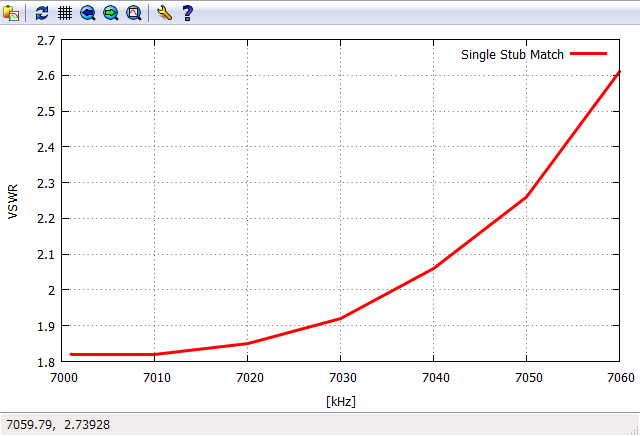
Looks reasonable?