
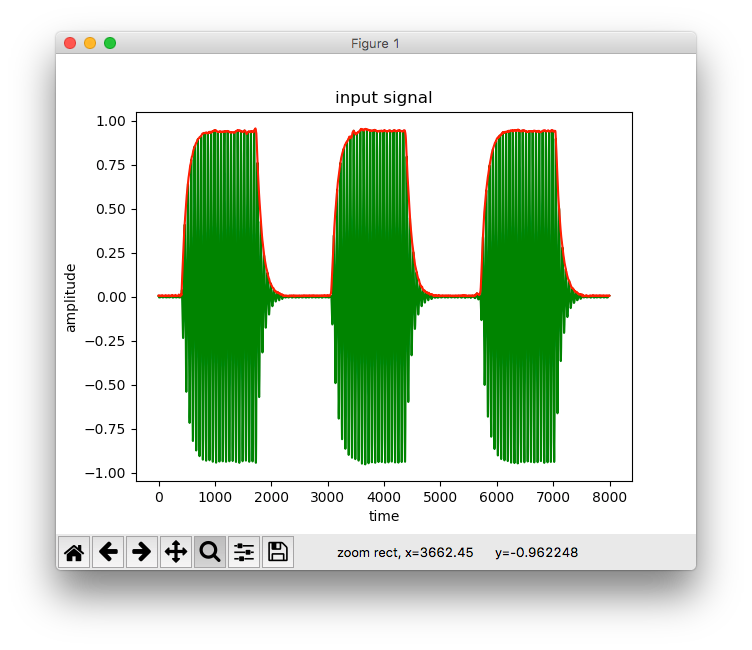
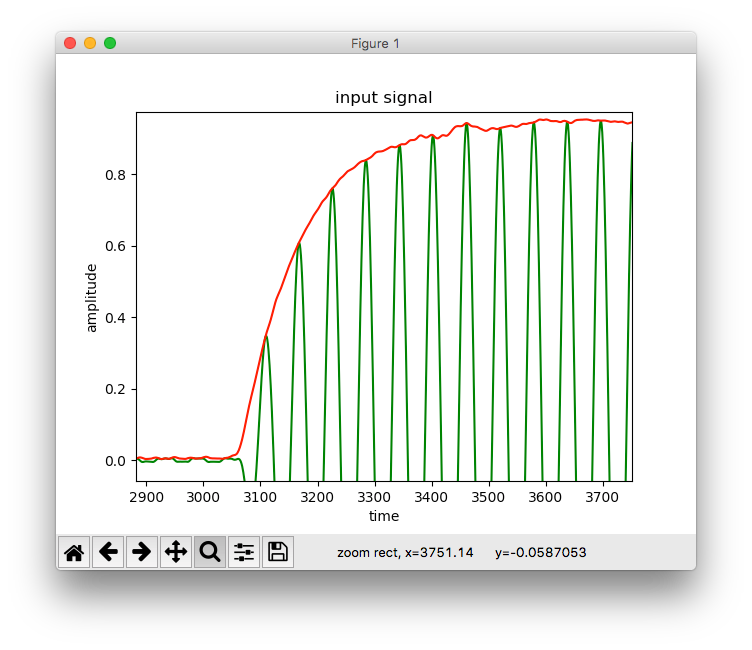
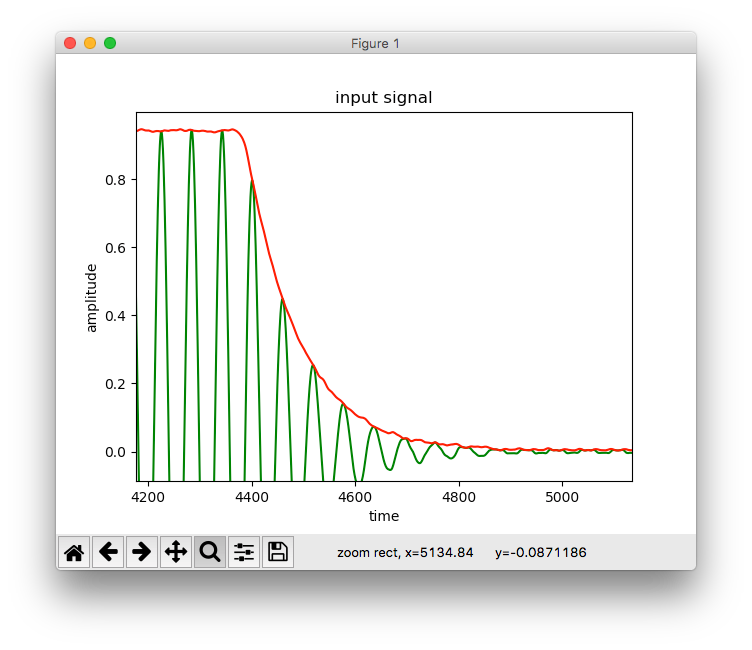
The envelope of the signal is obtained by computing the magnitude of the analytic signal.
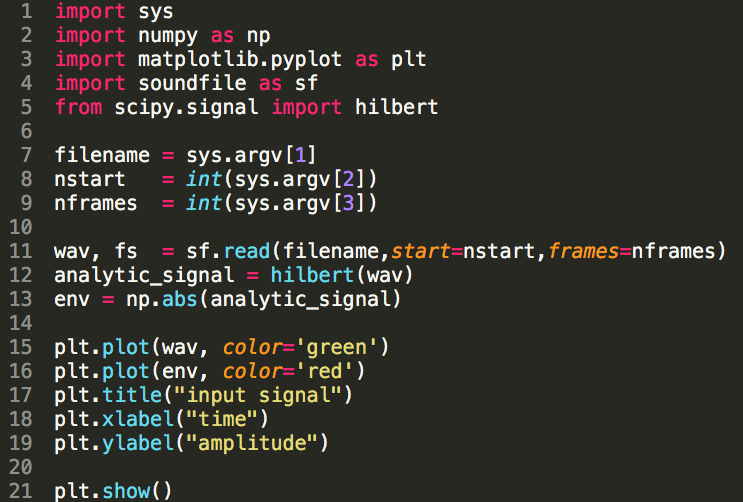
import sys
import numpy as np
import matplotlib.pyplot as plt
import soundfile as sf
from scipy.signal import hilbert

filename = sys.argv[1]
nstart   = int(sys.argv[2])
nframes  = int(sys.argv[3])

wav, fs  = sf.read(filename,start=nstart,frames=nframes)
analytic_signal = hilbert(wav)
env = np.abs(analytic_signal)

plt.plot(wav, color='green')
plt.plot(env, color='red')
plt.title("input signal")
plt.xlabel("time")
plt.ylabel("amplitude")

plt.show()
In my previous aritcle, Analytic Signals (2), the same thing is done using the C language.