import pyaudio
import numpy as np
import matplotlib.pyplot as plt
import time
import sys
import matplotlib.animation as animation
from scipy.signal import hilbert
from scipy.signal import medfilt
from sklearn.cluster import KMeans
CHUNK = 16384
FORMAT = pyaudio.paInt16
CHANNELS = 1
RATE = 8000
NMEDIAN = 51
NHIST = 100
duration_max = 1000
write_count = 0
read_count = 0
count = 0
trig_count = 0
t_up = 0
t_down = 0
y3_b4 = 0
up = []
down = []
x = np.arange(CHUNK)
y = np.zeros(CHUNK)
y1 = np.zeros(CHUNK)
y2 = np.zeros(CHUNK)
y3 = np.zeros(CHUNK)
#xx = np.arange(CHUNK*2)
yy = np.zeros(CHUNK*2)
y_buf = np.zeros(CHUNK*2)
p = pyaudio.PyAudio()
fig = plt.figure(1, figsize=(8, 12))
fig.subplots_adjust(hspace=0.7, wspace=0.1)
ax1 = fig.add_subplot(9,1,1)
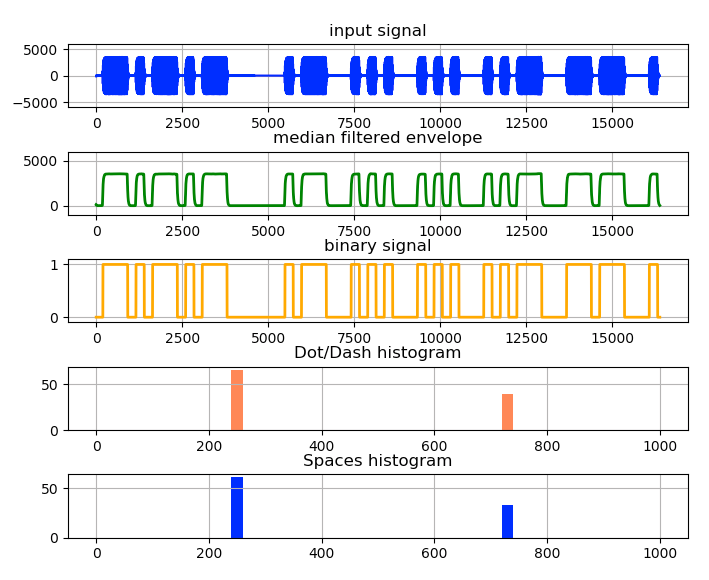
plt.title('input signal')
ax2 = fig.add_subplot(9,1,2)
plt.title('median filtered envelope')
ax3 = fig.add_subplot(9,1,3)
plt.title('binary signal')
ax4 = fig.add_subplot(9,1,4)
plt.title('Dot/Dash histogram')
ax5 = fig.add_subplot(9,1,5)
plt.title('Spaces histogram')
for ax in fig.axes:
ax.grid(True)
ax1.set_ylim(-6000, 6000)
ax2.set_ylim(-1000, 6000)
ax3.set_ylim(-0.1, 1.1)
line1, = ax1.plot(x, y, color='blue')
line2, = ax2.plot(x, y, color='green', lw=2)
line3, = ax3.plot(x, y, color='orange', lw=2)
def callback(in_data, frame_count, time_info, status):
global y_buf
global write_count
z = np.frombuffer(in_data, dtype="int16")
for i in range(CHUNK):
y_buf[i ] = y_buf[i+CHUNK]
y_buf[i+CHUNK] = z [i]
write_count += 1
return (None, pyaudio.paContinue)
stream = p.open(format=FORMAT, channels=CHANNELS, rate=RATE,
input=True, frames_per_buffer=CHUNK,
stream_callback=callback)
stream.start_stream()
def animate_init():
line1.set_ydata(y)
line2.set_ydata(y)
line3.set_ydata(y)
return line1, line2, line3
def animate(i):
global read_count, y1, y2
global count, trig_count, t_up, t_down, y3_b4, up, down
while write_count > read_count:
line1.set_ydata(y_buf)
y4 = medfilt(np.abs(hilbert(y_buf)), NMEDIAN)
for i in range(CHUNK):
y1[i] = y_buf[i+CHUNK//2]
y2[i] = y4 [i+CHUNK//2]
th = 0.5 * y2.max()
for i in range(CHUNK):
if y2[i] > th:
y3[i] = 1
else:
y3[i] = 0
for i in range(CHUNK):
if y3_b4 == 0 and y3[i] == 1:
trig_count += 1
t_up = i+read_count*CHUNK
t_down_duration = t_up - t_down
if trig_count > 1: # not the first time
down.append(t_down_duration)
if len(down) == NHIST:
ax4.hist(up, density=False, alpha=1.0, range=(0,duration_max), bins=50, color="coral")
ax5.hist(down, density=False, alpha=1.0, range=(0,duration_max), bins=50, color="blue")
up = []
down = []
if y3_b4 == 1 and y3[i] == 0 and trig_count > 0:
t_down = i+read_count*CHUNK
t_up_duration = t_down - t_up
up.append(t_up_duration)
y3_b4 = y3[i]
line1.set_ydata(y1)
line2.set_ydata(y2)
line3.set_ydata(y3)
read_count += 1
return line1, line2, line3
ani = animation.FuncAnimation(fig, animate, interval=100, init_func=animate_init, blit=True)
plt.show()
print('\njob end')
stream.stop_stream()
stream.close()
p.terminate()
