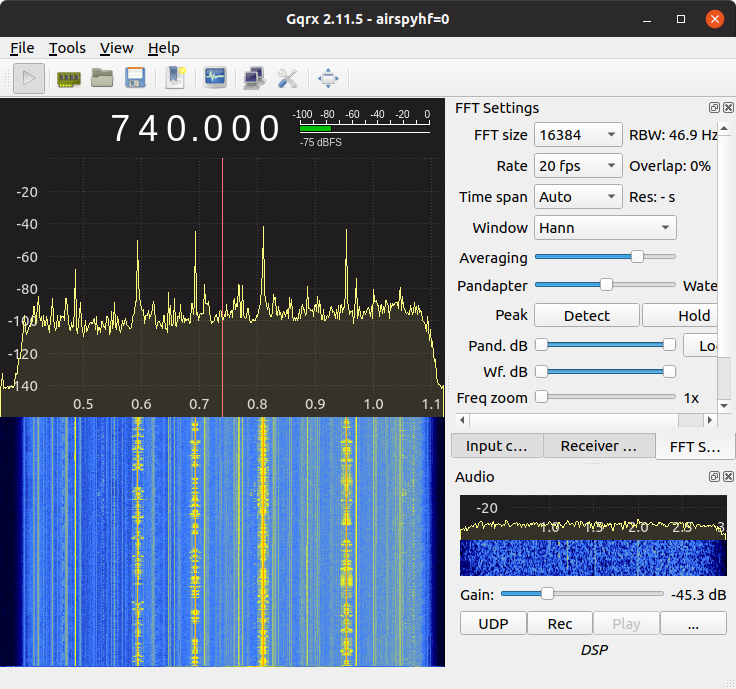
Listening to the AM band with Gqrx and airspyhf_rx.
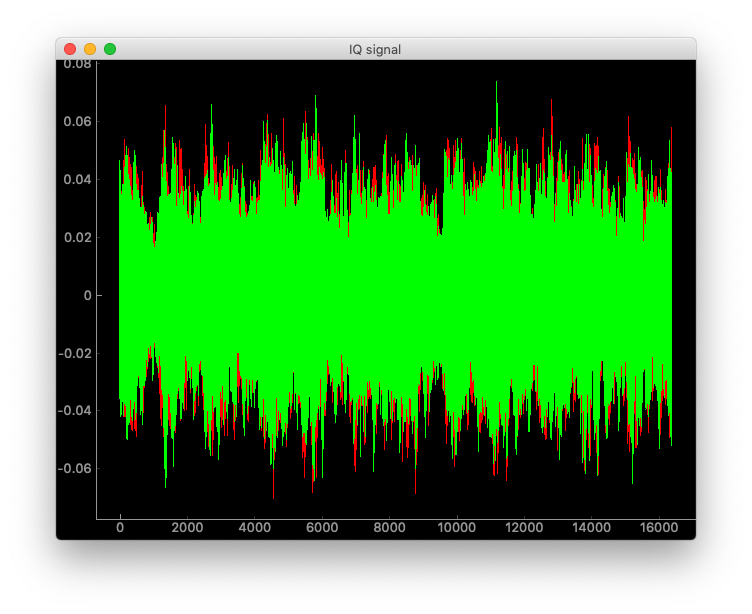
user1@Asrock ~ % airspyhf_rx -z -d -r stdout -f 0.740 -m on > iq.bin
user1@Asrock ~ % python3 pyqtgraph_test2.py
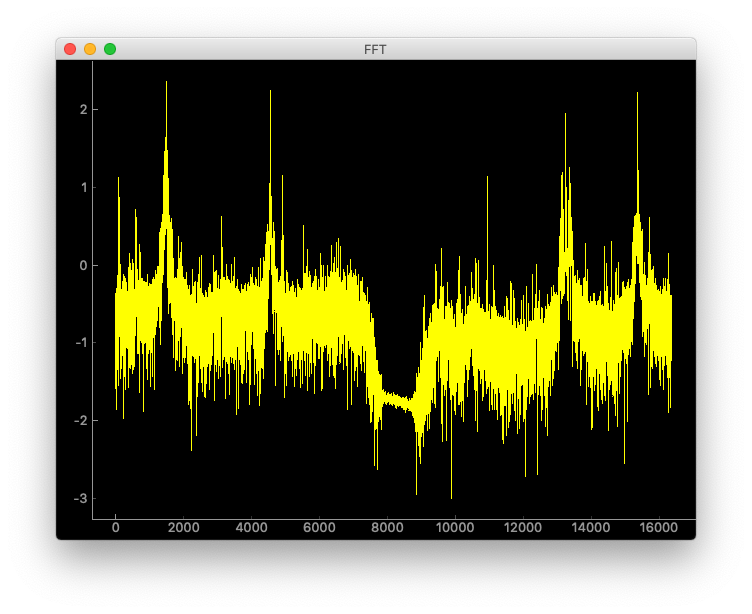
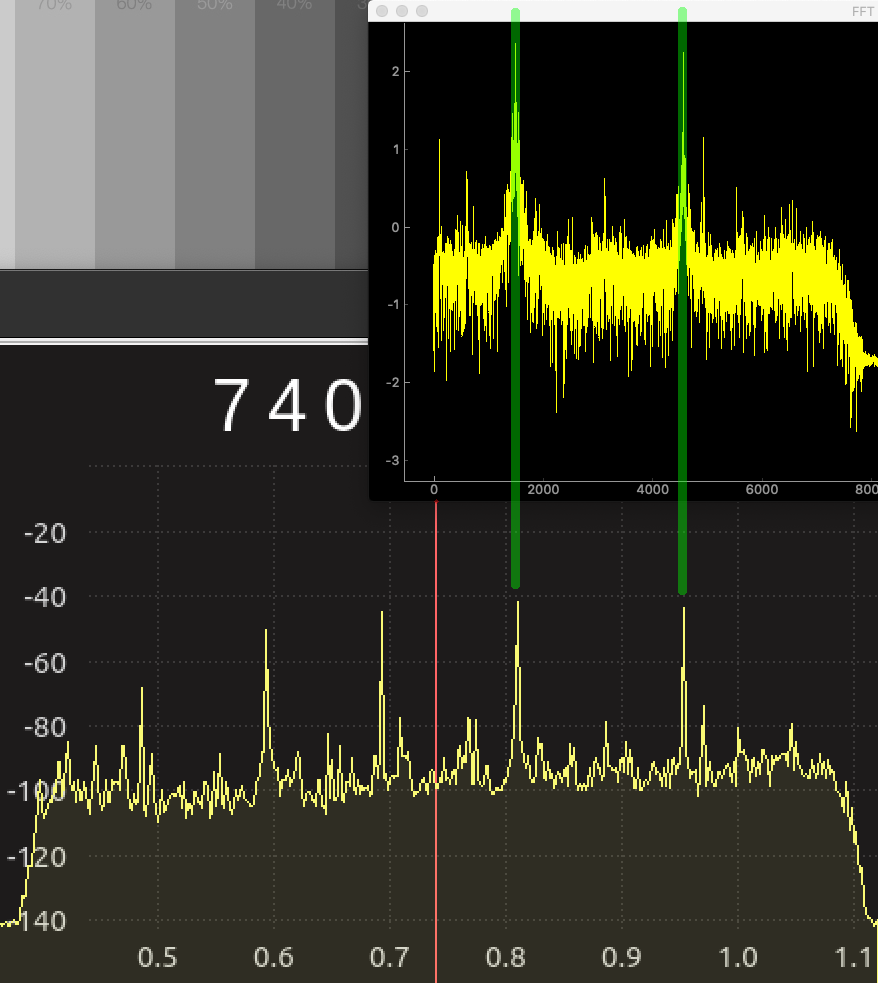
If you compare two graphs, they look almost the same?

Ham Radio Blog
Listening to the AM band with Gqrx and airspyhf_rx.
user1@Asrock ~ % airspyhf_rx -z -d -r stdout -f 0.740 -m on > iq.bin user1@Asrock ~ % python3 pyqtgraph_test2.py
If you compare two graphs, they look almost the same?