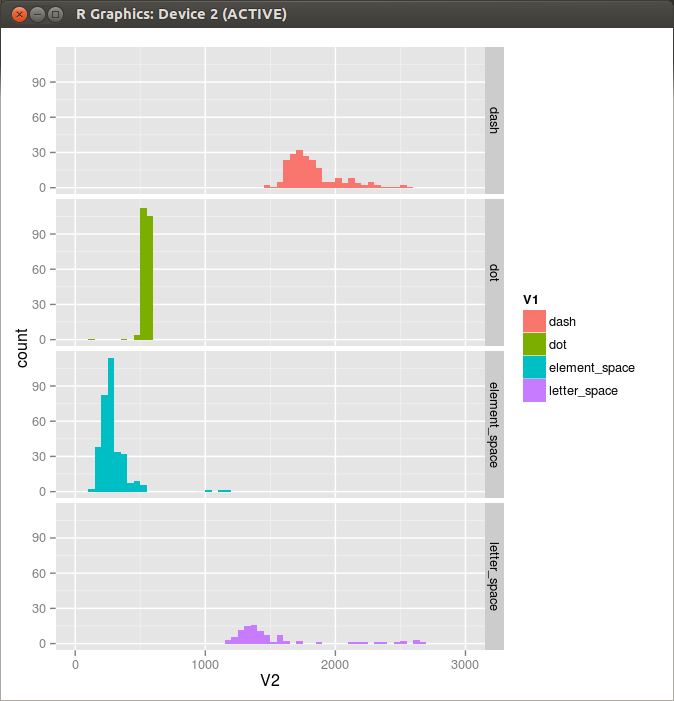
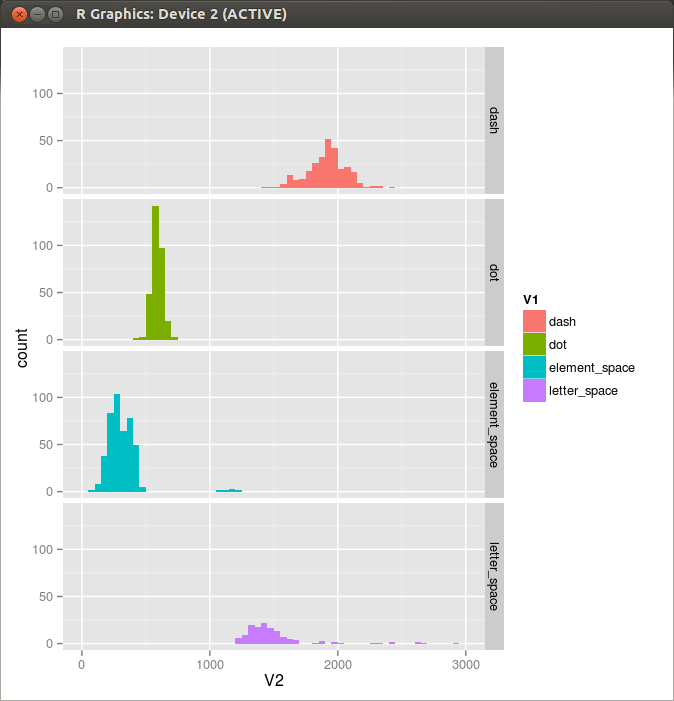
This is a histogram of Morse code by JO1FYC.
[1] http://homepage2.nifty.com/jo1fyc/sound/20051010_nikki-32.mp3
ggplot(mydata, aes(x=V2, fill=V1)) + geom_histogram(binwidth=50)+facet_grid(V1 ~ .)+xlim(0,3000)
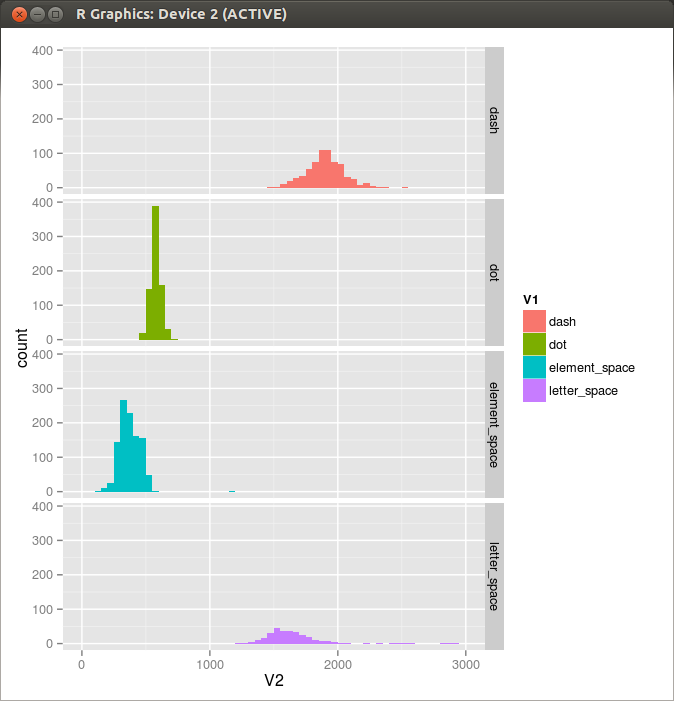
One more from JO1FYC.
[2] http://homepage2.nifty.com/jo1fyc/sound/20010915amenimomakezu.mp3
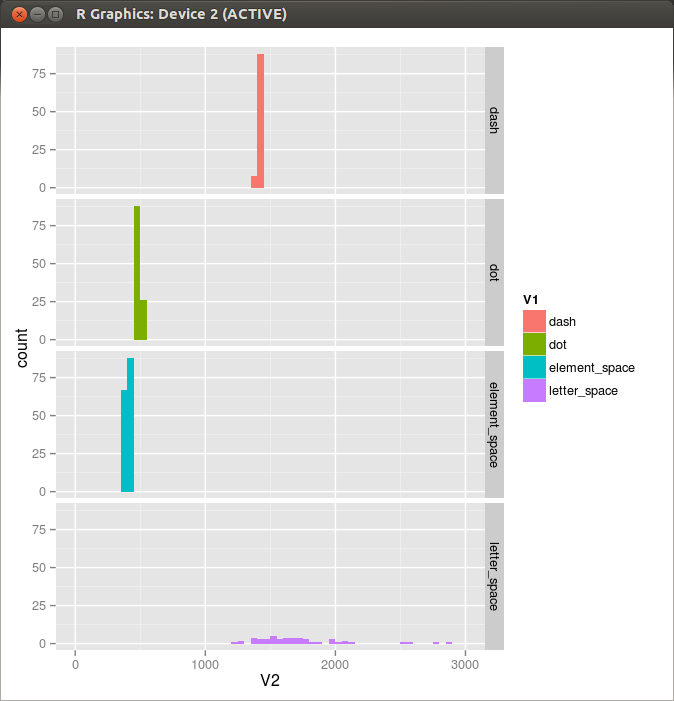
Still more from JO1FYC.
[3] http://homepage2.nifty.com/jo1fyc/sound/20010504nikki.MP3
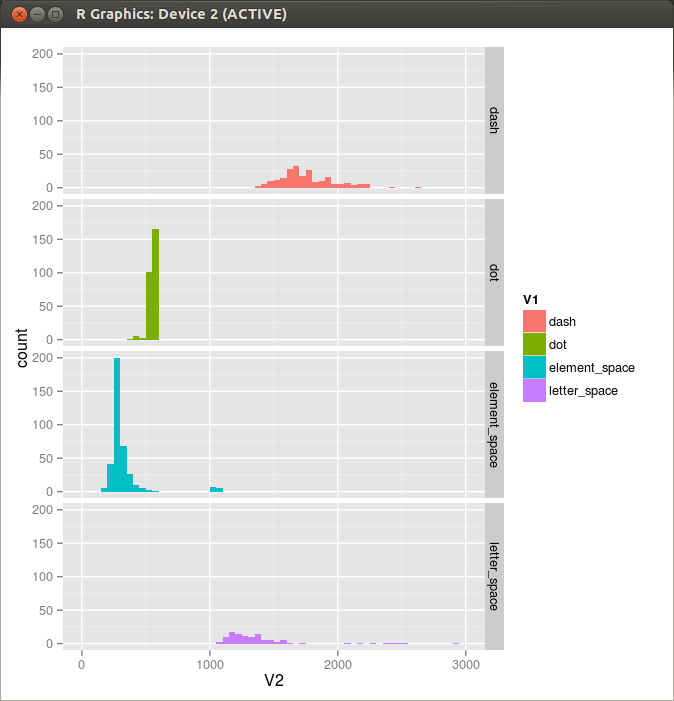
Yet another from JO1FYC.
[4] http://homepage2.nifty.com/jo1fyc/sound/20010504nikki02.MP3
Still another from JO1FYC.
[5] http://homepage2.nifty.com/jo1fyc/sound/20010504nikki03.MP3

