
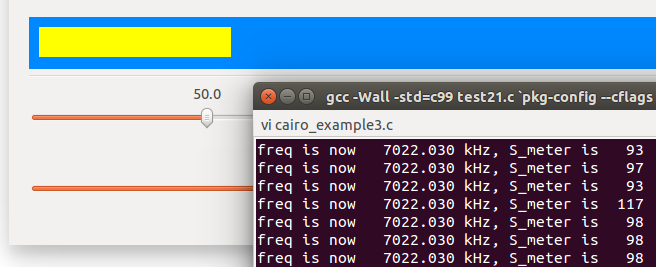
Now some graphics. This is supposed to be an S-meter. The length of the yellow bar shows the signal strength. The refresh rate is 10 frames per second, which means I am inquiring IC-7410 for the S-meter value every 100 mS.
I need to do some calibrations. The only available information from the instruction manual is that 0000=S0, 0120=S9, and 0240=S9+60dB.
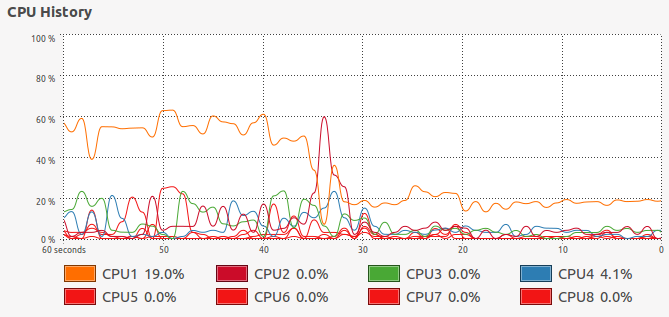
The CPU load drops significantly when the program is terminated.
With grig there is almost no change in the CPU load, so there is a room for improvement.