

From the measured parameters that the voltage ratio V2/V1 is 0.698 and the phase difference is -57.7 [deg], you can write a vector diagram.
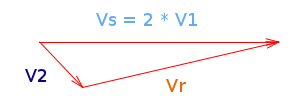
And from the diagram:
(%i1) Vs:1.0+%i*0.0;
(%i2) t:(-57.7/360.0)*2.0*%pi;    <- measured phase difference
(%i3) s:0.698/2.0;                <- measured voltage ratio times 1/2
(%i4) V2:s*(cos(t)+%i*sin(t));
(%i5) Vr:Vs-V2;                   <- voltage across R6
(%i6) z:50.0*(V2/Vr);             <- R6 is a 50 [phm] resistor
(%i7) float(realpart(z));
(%o7) 4.319309419115194
(%i8) float(imagpart(z));
(%o8) -19.69733542559636
(%i9) y:1/z;
(%i10) 1/realpart(y);
(%o10) 94.14602759832886          <- nominal 100 [ohm]
(%i11) 1/imagpart(y);
(%o12) 20.64445990101613
(%i28) float(1/(2.0*%pi*7026e3*(1/imagpart(y))));
(%o28) 1.0972572543782682*10^-9   <- nominal 1 [nF]