
The same 9m coax cable but with its far end terminated with 100ohm.
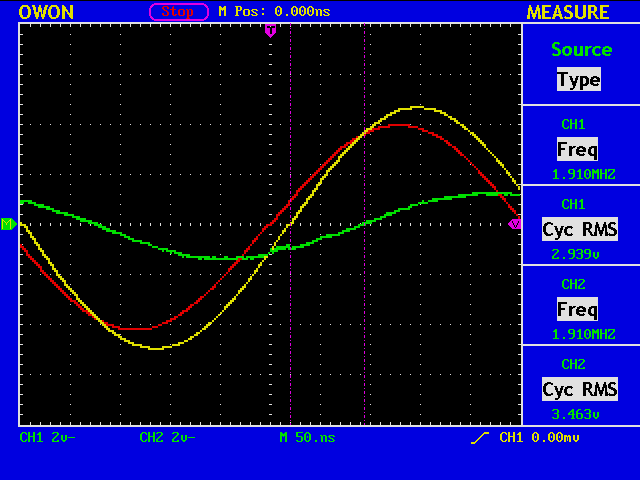
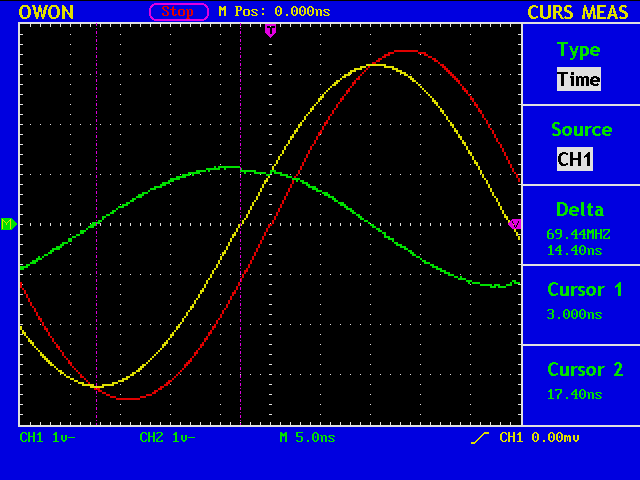
At 1910kHz (T=523.6nS) the delay of V2 (yellow) against V1 (red) is +19.00nS (=+13.1deg) and V2-V1 (green) +91nS (=+62.6deg), whereas V1=2.939V and V2=3.463V (V2/V1=1.18).
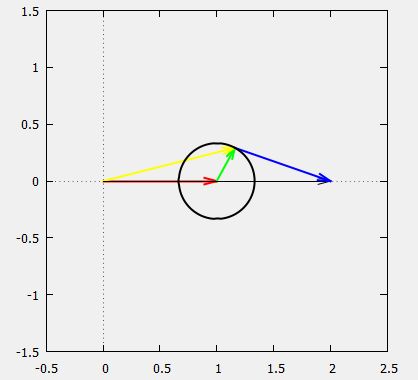
Theoretically, the magnitude of the reflection coefficient in this case is (ZL-Zs)/(ZL+Zs)=1/3, and its phase is 61.6deg (=2.0*360.0*(9/0.67)/(300/1.91)), which gives the relationship between the incident wave (=V1, red) and the reflected wave (=V2-V1, green).
From the figure, you can see that V2 (yellow) should be mag=1.19 and phase=14.1 deg, both in good agreement with the measurement.
gnuplot> set object 1 rectangle from screen 0,0 to screen 1,1 fillcolor rgb "#f0f0f0" behind
gnuplot> set size square
gnuplot> set xrange[-0.5:2.5]
gnuplot> set yrange[-1.5:1.5]
gnuplot> set zeroaxis
gnuplot> set parametric
gnuplot> plot [0:2*pi] 1+cos(t)/3,sin(t)/3 lw 2 lt -1
gnuplot> set arrow 1 from 0.0 to 1.0 lw 2 lt -1
gnuplot> set arrow 2 from 1,0 to 1+cos(1.07)/3,sin(1.07)/3 lw 2 lt 2
gnuplot> set arrow 3 from 0,0 to 1+cos(1.07)/3,sin(1.07)/3 lw 2 lt 6
gnuplot> set arrow 4 from 0.0 to 2,0 lw 1 lt -1
gnuplot> set arrow 5 from 1+cos(1.07)/3,sin(1.07)/3 to 2,0 lw 2 lt 3
gnuplot> replot
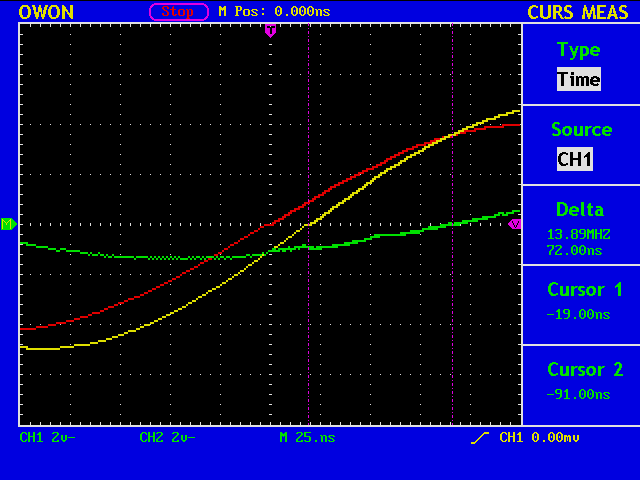
The same configuration, but at 18100kHz. The phase of the reflection coefficient in this case becomes 583.5deg, or 223.5deg by subtracting 360deg.
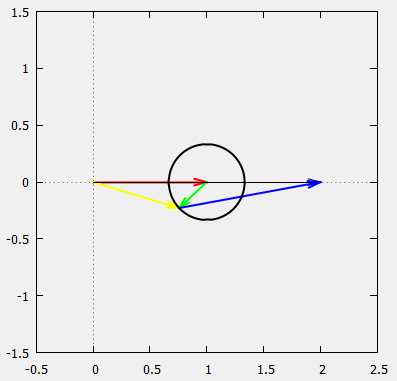
From the figure, it is expected that V2 (yellow) is mag=0.79 and phase=-16.8 deg.
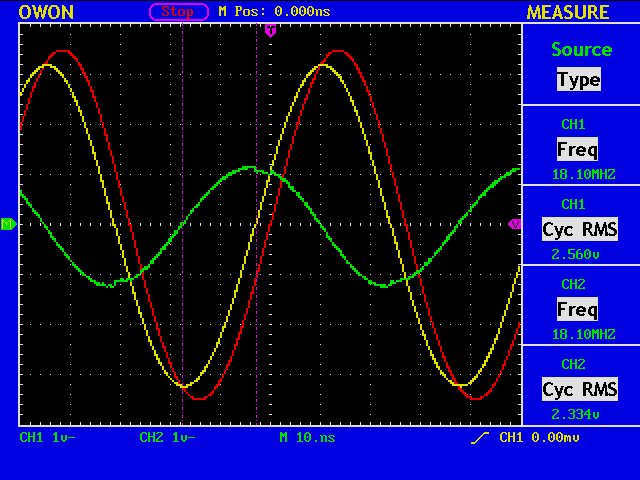
From the measurement, we see that V2 (yellow)/V1 (red)=2.334/2.560=0.911 and the phase of V2 relative to V1 is -19.6deg.