

> At 1910kHz (T=523.6nS). The delay is +43.00nS (+29.6deg), V1=3.094V and V2=5.256V both measured using CH1 (V2/V1=1.70).
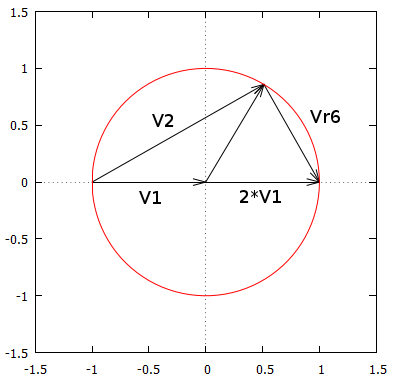
(%i) t:(-29.6/360.0)*2.0*%pi; <- negative for delay
(%i) s:1.7/2;
(%i) Vs:1.0+%i*0.0;
(%i) V2:s*(cos(t)+%i*sin(t));
(%i) Vr:Vs-V2;
(%i) z:50.0*(V2/Vr);
(%i) float(realpart(z));
(%o) 3.390649793776409
(%i) float(imagpart(z));
(%o) -85.90869167405812
Therefore, the impedance of the DUT, a 9m coax cable with open end, is Z=3.39-85.91i.
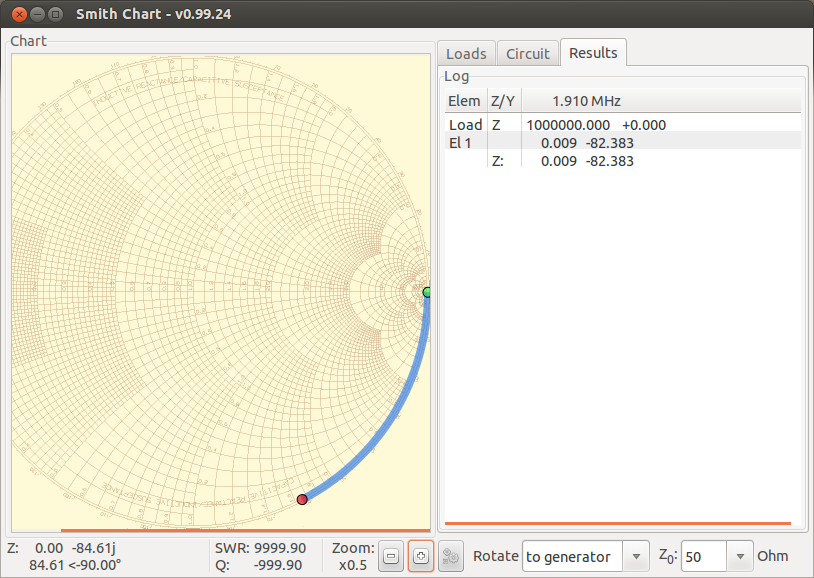
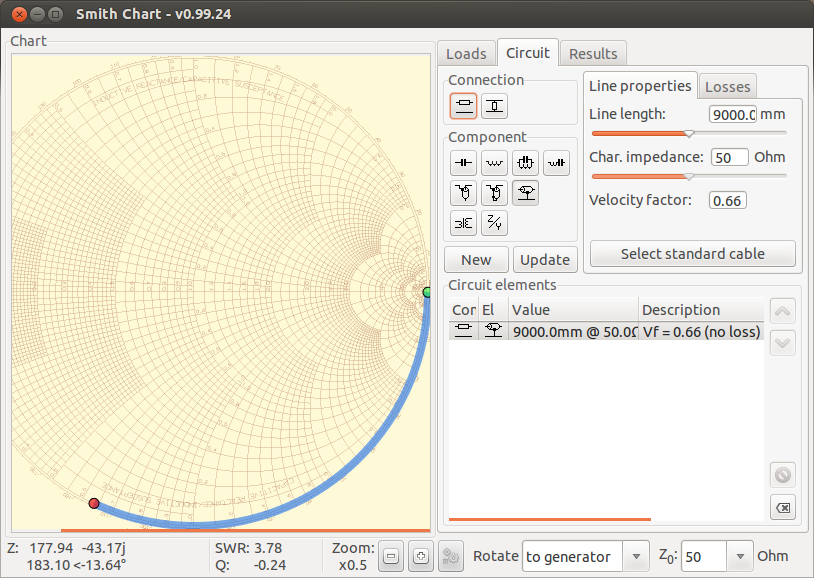
By using the Smith Chart, we get Z=0.01-82.38i with a 9m coax cable.
> At 3526kHz (T=283.6nS). The delay is +44.80nS (+56.9deg), V1=2.641V and V2=2.694V both measured using CH1 (V2/V1=1.02).
(%i) t:(-56.9/360.0)*2.0*%pi; <- negative for delay
(%i) s:1.02/2;
(%i) float(realpart(z));
(%o) 1.309389036427464
(%i) float(imagpart(z));
(%o) -30.38338285043538
The Smith Chart shows that Z=0.00-31.61i.