Python Programs for RigExpert AA-30 Zero (3)

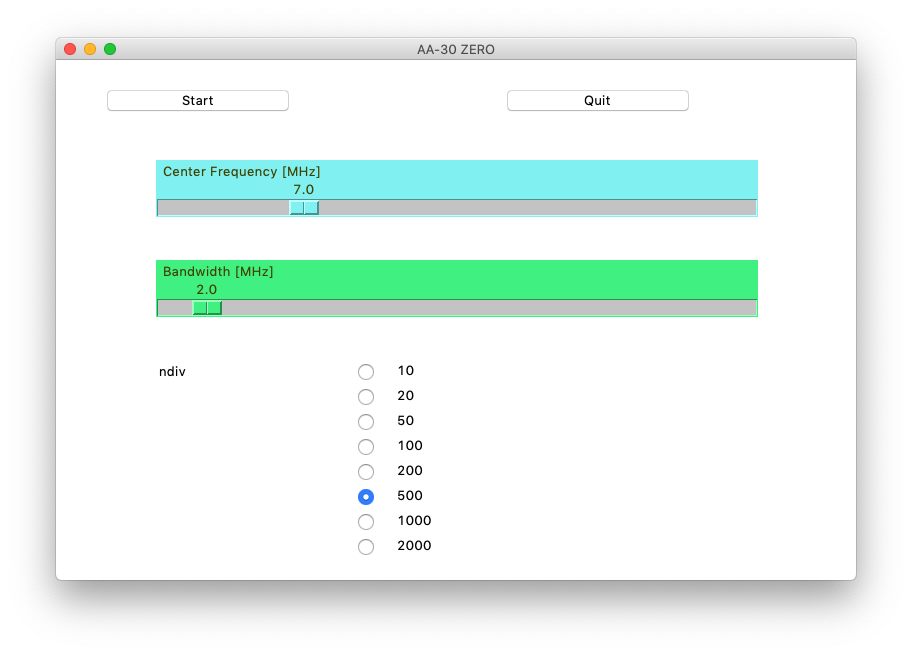
The Center Frequency and the Bandwidth are set with sliders.

# aa30zero_gui.py

import serial
import time
import sys
import math
import tkinter as tk
import matplotlib.pyplot as plt


def mystart(event):
    print("clicked at", event.x, event.y, ", v = ", v2.get())
    print(Slider0.get(), Slider1.get())
    measure(Slider0.get(), Slider1.get(), v2.get())


def myquit(event):
    print("quit at", event.x, event.y)
    sys.exit(0)


def measure(i0, i1, i2):
    f = open('touchstone.s1p', 'w')
    ser = serial.Serial('/dev/cu.usbmodem14701', 38400, timeout=1)
    print(ser.name)

    time.sleep(2)
    command_0 = b'ver' + b'\x0a'
    print(command_0)
    ser.write(command_0)

    time.sleep(1)
    command_1 = b'fq' + str(int(10.0 * i0)).encode('ASCII') + b'00000' + b'\x0a'
    print(command_1)
    ser.write(command_1)

    time.sleep(1)
    command_2 = b'sw' + str(int(10.0 * i1)).encode('ASCII') + b'00000' + b'\x0a'
    print(command_2)
    ser.write(command_2)

    for i in range(3):
        line = ser.readline()
        print(line)

    time.sleep(1)
    ser.write(b'frx' + str(ndiv_list[i2]).encode('ASCII') + b'\x0a')

    f.write('# MHz S RI R 50 \n')

    z0 = complex(50.0, 0.0)
    freq_list = []
    zr_list = []
    zi_list = []
    retloss_list = []
    vswr_list = []

    for i in range(int(ndiv_list[i2]) + 1):
        line = ser.readline().decode(encoding='utf-8').rstrip().split(',')
        freq = float(line[0])
        if freq < 0.5:
            continue
        z = complex(float(line[1]), float(line[2]))
        rho = (z - z0) / (z + z0)
        retloss = -20.0 * math.log10(abs(rho))
        vswr = (1 + abs(rho)) / (1 - abs(rho))
        freq_list.append(freq)
        zr_list.append(z.real)
        zi_list.append(z.imag)
        retloss_list.append(retloss)
        vswr_list.append(vswr)
        print(freq, z.real, z.imag, rho, retloss, vswr)
        f.write('{0} {1} {2} \n'.format(freq, rho.real, rho.imag))

    for i in range(1):
        line = ser.readline()
        print(line)

    ser.close()

    fig = plt.figure(1, figsize=(8, 18))
    ax0 = fig.add_subplot(311)
    ax0.plot(freq_list, zr_list, 'r-', label='Real{Z}', linewidth=3)
    ax0.plot(freq_list, zi_list, 'b-', label='Imag{Z}', linewidth=3)

    ax1 = fig.add_subplot(312)
    ax1.plot(freq_list, retloss_list, 'c-', label='Return Loss', linewidth=3)

    ax2 = fig.add_subplot(313)
    ax2.plot(freq_list, vswr_list, 'y-', label='VSWR', linewidth=3)

    global plt_count
    if plt_count == 0:
        ax0.set_xlabel('frequency [MHz]')
        ax0.set_ylabel('Z [ohm]')
        ax0.set_title("Impedance")
        ax0.grid()
        ax0.legend()

        ax1.set_xlabel('frequency [MHz]')
        ax1.set_ylabel('Return Loss [dB]')
        ax1.set_title("Return Loss")
        ax1.grid()
        ax1.legend()

        ax2.set_xlabel('frequency [MHz]')
        ax2.set_ylabel('VSWR')
        ax2.set_title("VSWR")
        ax2.grid()
        ax2.legend()

        plt.subplots_adjust(hspace=0.4)
    plt_count += 1
    plt.show()


plt_count = 0

ndiv_list = [10, 20, 50, 100, 200, 500, 1000, 2000]

root = tk.Tk()
root.title('AA-30 ZERO')
root.geometry('800x520')

Button = tk.Button(text='Start', width=20)
Button.bind("<Button-1>", mystart)
Button.place(x=50, y=30)

Button2 = tk.Button(text='Quit', width=20)
Button2.bind("<Button-1>", myquit)
Button2.place(x=450, y=30)

Slider0 = tk.Scale(root, from_=0.1, to=30.0,
                   orient=tk.HORIZONTAL, resolution=0.1,
                   digits=3, length=600, fg='#404000', bg='#80f0f0',
                   label='Center Frequency [MHz]')
Slider1 = tk.Scale(root, from_=0.1, to=30.0,
                   orient=tk.HORIZONTAL, resolution=0.2,
                   digits=3, length=600, fg='#404000', bg='#40f080',
                   label='Bandwidth [MHz]')

Slider0.place(x=100, y=100)
Slider1.place(x=100, y=200)

Slider0.set(7.0)
Slider1.set(2.0)

v2 = tk.IntVar()
v2.set(0)
tk.Label(root, text='ndiv').place(x=100, y=300)
for index, value in enumerate(ndiv_list):
    tk.Radiobutton(root,
                   text=value,
                   padx=20,
                   variable=v2,
                   value=index).place(x=300, y=300 + 25 * index)

root.mainloop()
sys.exit(0)

Python Programs for RigExpert AA-30 Zero (2)

This is a GUI version of the program.

The Tkinter module is used to take care of the GUI part of the program.

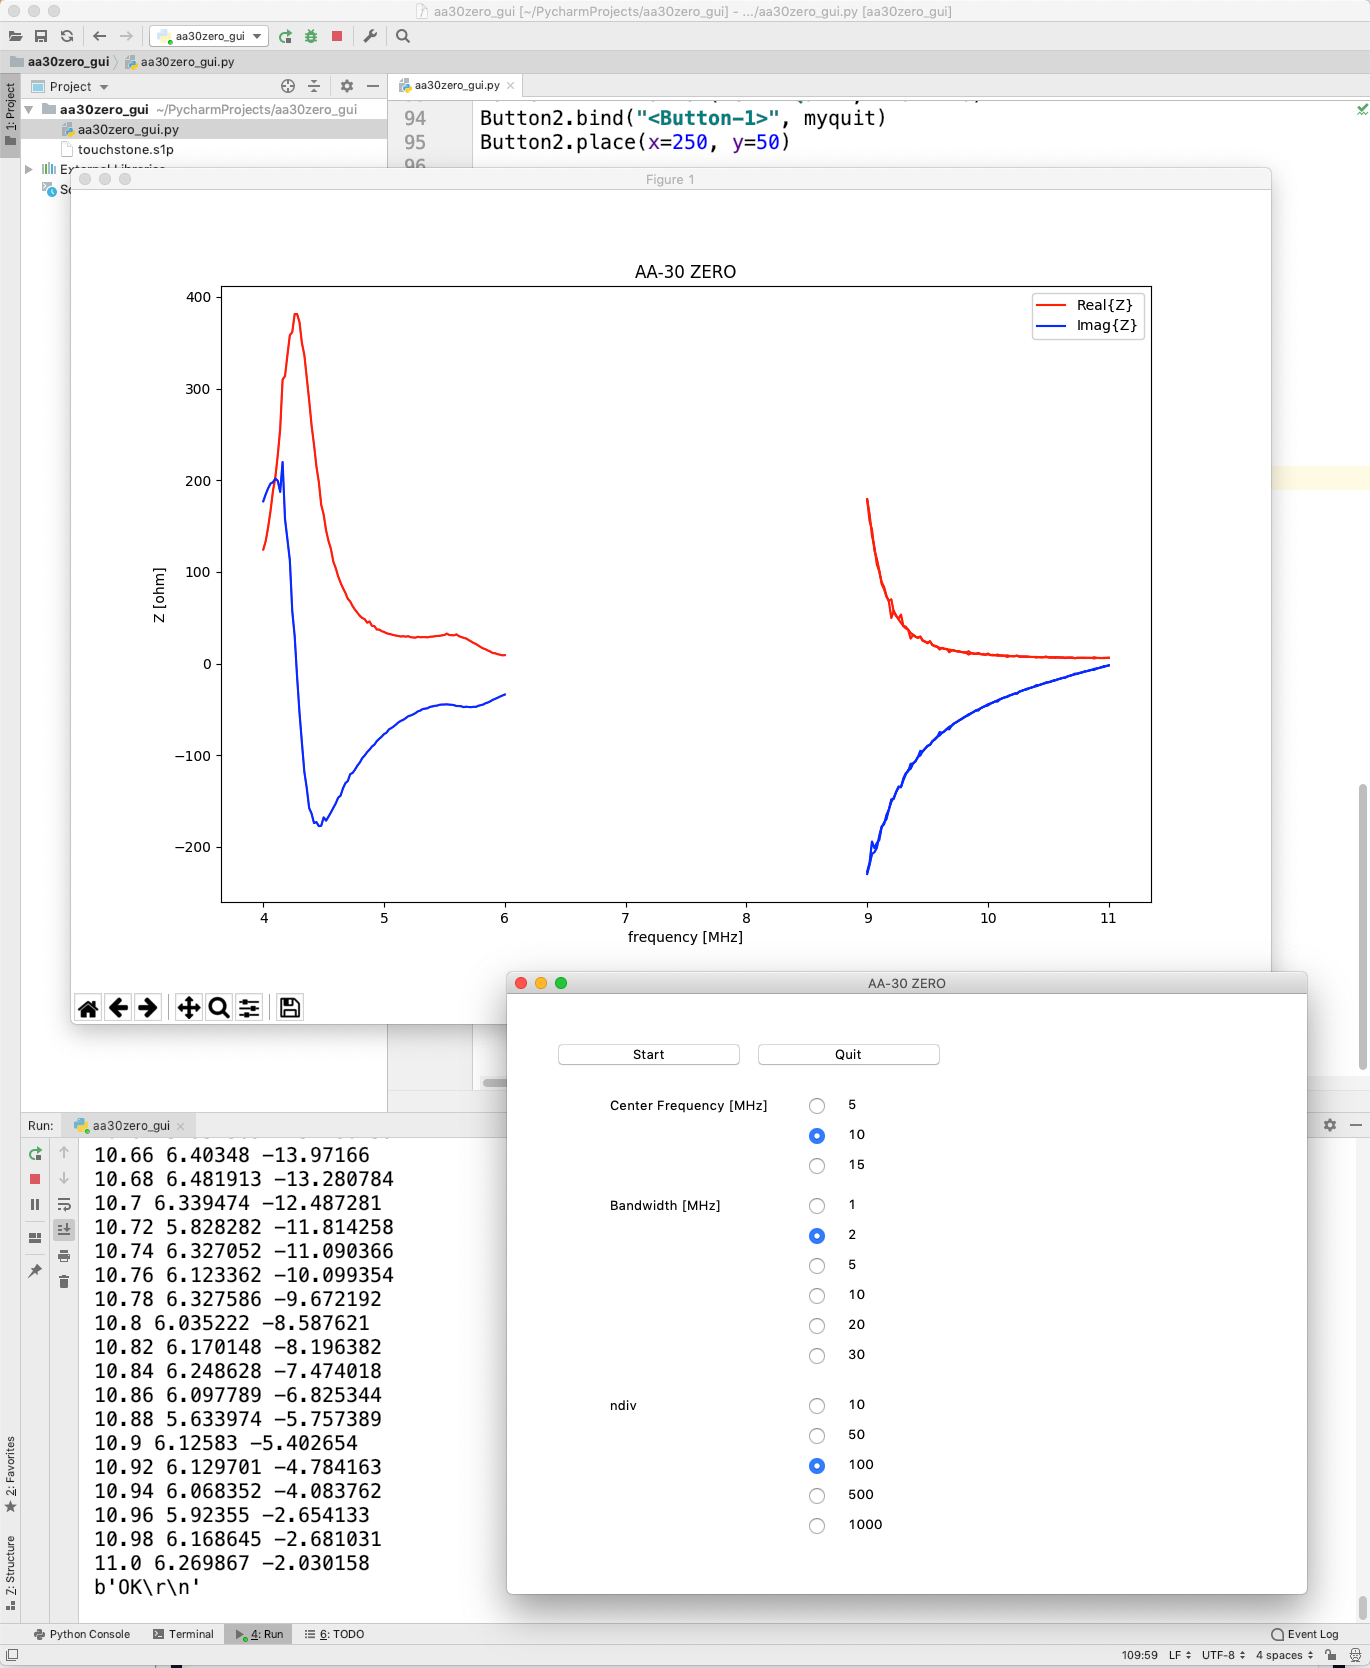
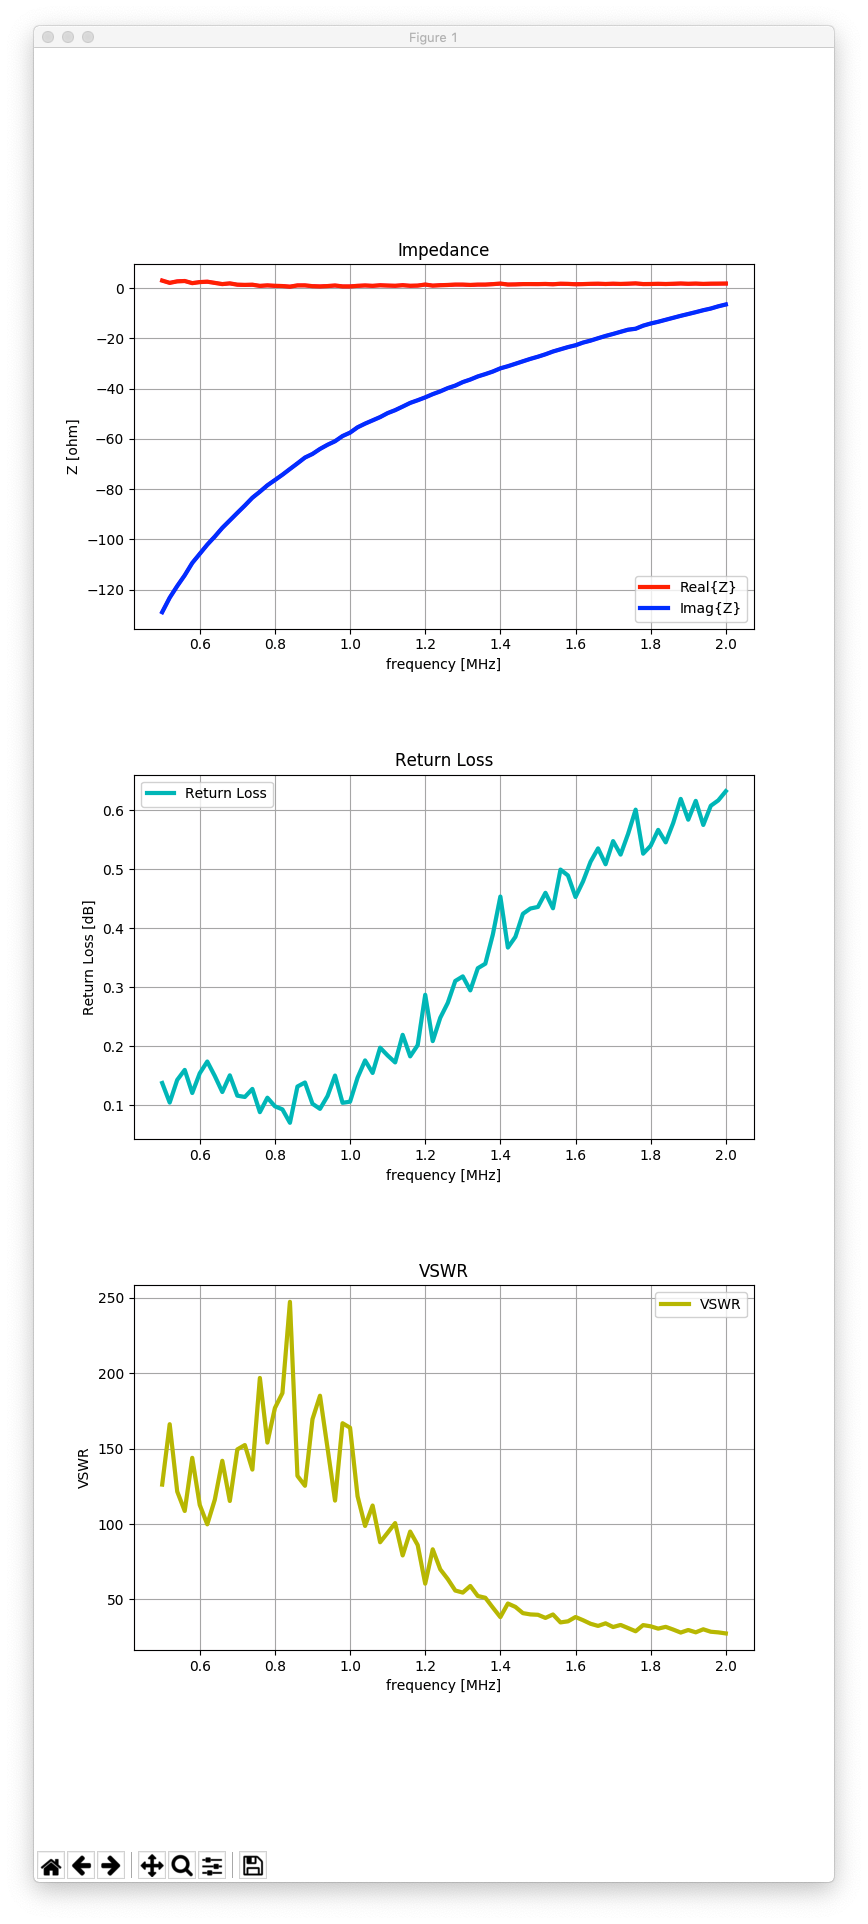
You can repeat the measurement with different parameters, and plot the results onto the same graph.

# aa30zero_gui.py

import serial
import time
import sys
import tkinter as tk
import matplotlib.pyplot as plt


def mystart(event):
    print("clicked at", event.x, event.y, ", v = ", v0.get(), v1.get(), v2.get())
    measure(v0.get(), v1.get(), v2.get())


def myquit(event):
    print("quit at", event.x, event.y)
    sys.exit(0)


def measure(i0, i1, i2):
    f = open('touchstone.s1p', 'w')
    ser = serial.Serial('/dev/cu.usbmodem14701', 38400, timeout=1)
    print(ser.name)

    time.sleep(2)
    ser.write(b'ver' + b'\x0a')

    time.sleep(1)
    ser.write(b'fq' + str(freq_list[i0]).encode('ASCII') + b'000000' + b'\x0a')

    time.sleep(1)
    ser.write(b'sw' + str(bw_list[i1]).encode('ASCII') + b'000000' + b'\x0a')

    for i in range(3):
        line = ser.readline()
        print(line)

    time.sleep(1)
    ser.write(b'frx' + str(ndiv_list[i2]).encode('ASCII') + b'\x0a')

    f.write('# MHz S RI R 50 \n')

    z0 = complex(50.0, 0.0)
    ff_list = []
    zr_list = []
    zi_list = []

    for i in range(int(ndiv_list[i2]) + 1):
        line = ser.readline().decode(encoding='utf-8').rstrip().split(',')
        freq = float(line[0])
        z = complex(float(line[1]), float(line[2]))
        rho = (z - z0) / (z + z0)
        ff_list.append(freq)
        zr_list.append(z.real)
        zi_list.append(z.imag)
        print(freq, z.real, z.imag)
        f.write('{0} {1} {2} \n'.format(freq, rho.real, rho.imag))

    for i in range(1):
        line = ser.readline()
        print(line)

    ser.close()

    plt.figure(1, figsize=(12, 8))
    plt.plot(ff_list, zr_list, 'r-', label='Real{Z}')
    plt.plot(ff_list, zi_list, 'b-', label='Imag{Z}')

    global plt_count
    if plt_count == 0:
        plt.legend()
        plt.xlabel('frequency [MHz]')
        plt.ylabel('Z [ohm]')
        plt.title("AA-30 ZERO")
    plt_count += 1
    plt.show()


plt_count = 0

freq_list = [5, 10, 15]
bw_list = [1, 2, 5, 10, 20, 30]
ndiv_list = [10, 50, 100, 500, 1000]

root = tk.Tk()
root.title('AA-30 ZERO')
root.geometry('800x600')

Button = tk.Button(text='Start', width=20)
Button.bind("<Button-1>", mystart)
Button.place(x=50, y=50)

Button2 = tk.Button(text='Quit', width=20)
Button2.bind("<Button-1>", myquit)
Button2.place(x=250, y=50)

v0 = tk.IntVar()
v0.set(0)
tk.Label(root, text='Center Frequency [MHz]').place(x=100, y=100)
for index, value in enumerate(freq_list):
    tk.Radiobutton(root,
                   text=value,
                   padx=20,
                   variable=v0,
                   value=index).place(x=300, y=100 + 30 * index)

v1 = tk.IntVar()
v1.set(0)
tk.Label(root, text='Bandwidth [MHz]').place(x=100, y=200)
for index, value in enumerate(bw_list):
    tk.Radiobutton(root,
                   text=value,
                   padx=20,
                   variable=v1,
                   value=index).place(x=300, y=200 + 30 * index)
v2 = tk.IntVar()
v2.set(0)

tk.Label(root, text='ndiv').place(x=100, y=400)
for index, value in enumerate(ndiv_list):
    tk.Radiobutton(root,
                   text=value,
                   padx=20,
                   variable=v2,
                   value=index).place(x=300, y=400 + 30 * index)

root.mainloop()
sys.exit(0)
Python Programs for RigExpert AA-30 Zero

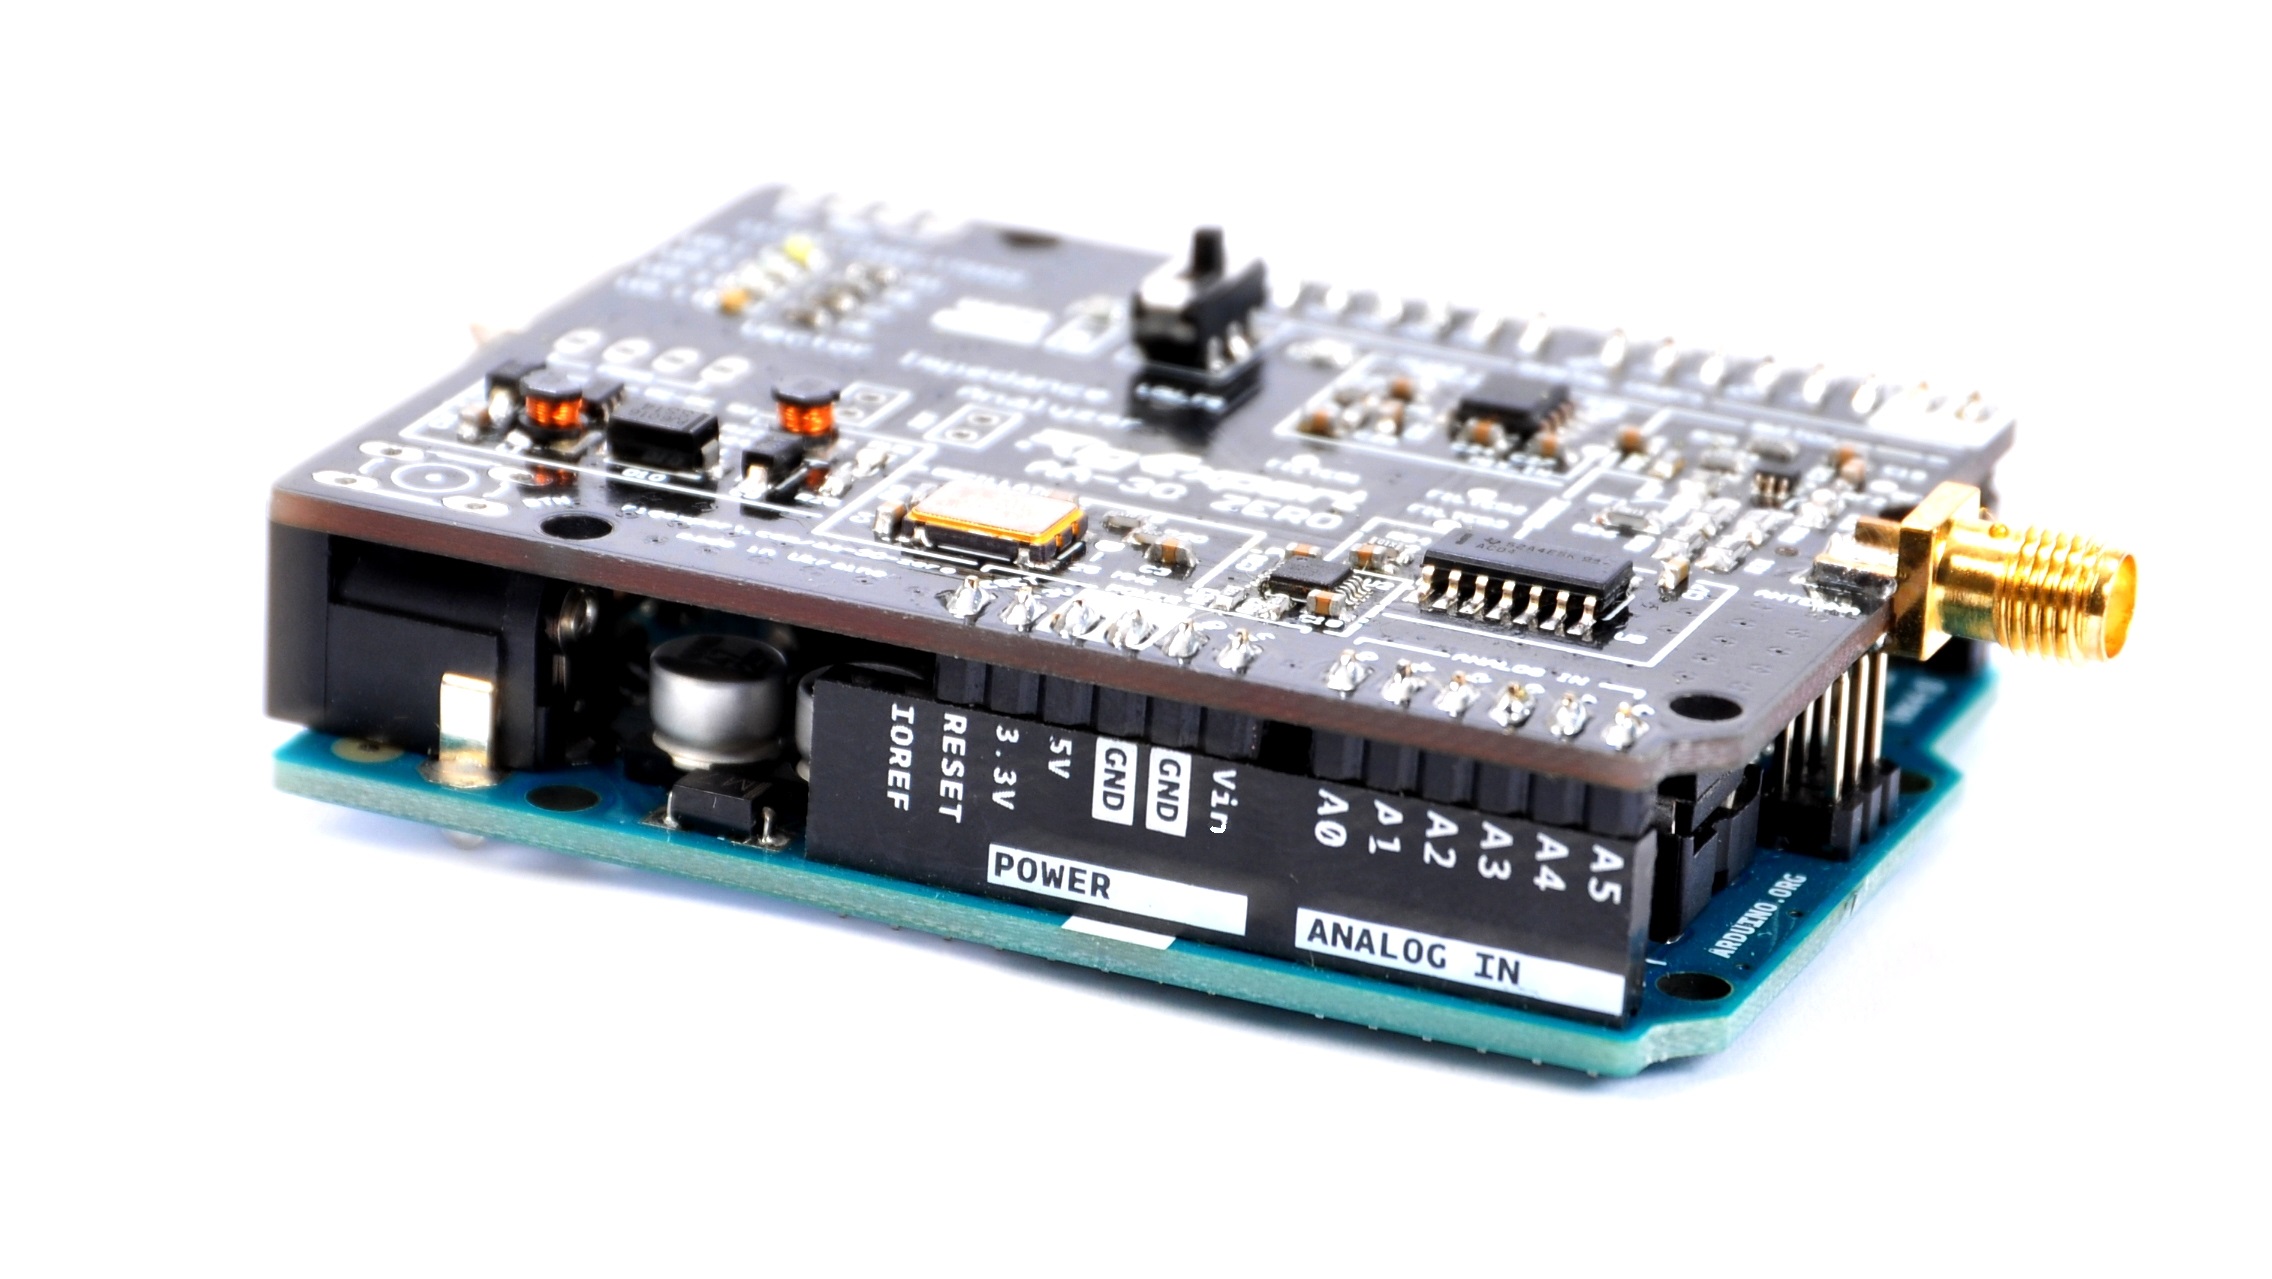
AA-30 Zero is a low-lost antenna analyzer from RigExpert.

My previous version of the programs were written in C, C++, AWK, and gnuplot, so here comes a Python version.

# aa30zero.py

import serial
import time
import argparse

parser = argparse.ArgumentParser()
parser.add_argument("freq", help="center freq in kHz, example 7000000")
parser.add_argument("bw", help="band width in kHz, example 2000000")
parser.add_argument("ndiv", help="no. of divisions, example 100")

args = parser.parse_args()
print('!! freq = ', args.freq)
print('!! bw = ', args.bw)
print('!! ndiv = ', args.ndiv)

ser = serial.Serial('/dev/cu.usbmodem14701', 38400, timeout=1)
print('!! ', ser)

time.sleep(2)
ser.write(b'ver'+b'\x0a')

time.sleep(1)
ser.write(b'fq'+args.freq.encode('ASCII')+b'\x0a')

time.sleep(1)
ser.write(b'sw'+args.bw.encode('ASCII')+b'\x0a')

for i in range(3):
    line = ser.readline()
    print('!! ', line)

time.sleep(1)
ser.write(b'frx'+args.ndiv.encode('ASCII')+b'\x0a')

print('# MHz S RI R 50')
z0 = complex(50.0, 0.0)

for i in range(int(args.ndiv)+1):
    line = ser.readline().decode(encoding='utf-8').rstrip().split(',')
    freq = float(line[0])
    z = complex(float(line[1]), float(line[2]))
    rho = (z-z0)/(z+z0)
    print('! ', freq, z.real, z.imag)
    print(freq, rho.real, rho.imag)

for i in range(1):
    line = ser.readline()
    print('!! ', line)

ser.close()

The first program controls AA-30 Zero and creates a touchstone file.

A Python library pySerial is used to talk with the device.

$ python aa30zero.py 5200000 1000000 100 | tee touchstone.s1p
 
$ cat touchstone.s1p
!! freq =  5200000
!! bw =  1000000
!! ndiv =  100
!!  Serial<id=0x10fab2860, open=True>(port='/dev/cu.usbmodem14701', baudrate=38400, bytesize=8, parity='N', stopbits=1, timeout=1, xonxoff=False, rtscts=False, dsrdtr=False)
!!  b'AA-30 ZERO 150\r\n'
!!  b'OK\r\n'
!!  b'OK\r\n'
# MHz S RI R 50
!  4.7 26.910389 -45.76308
4.7 0.0397565169109296 -0.5713623335864779
...

$ python scikit-rf.py

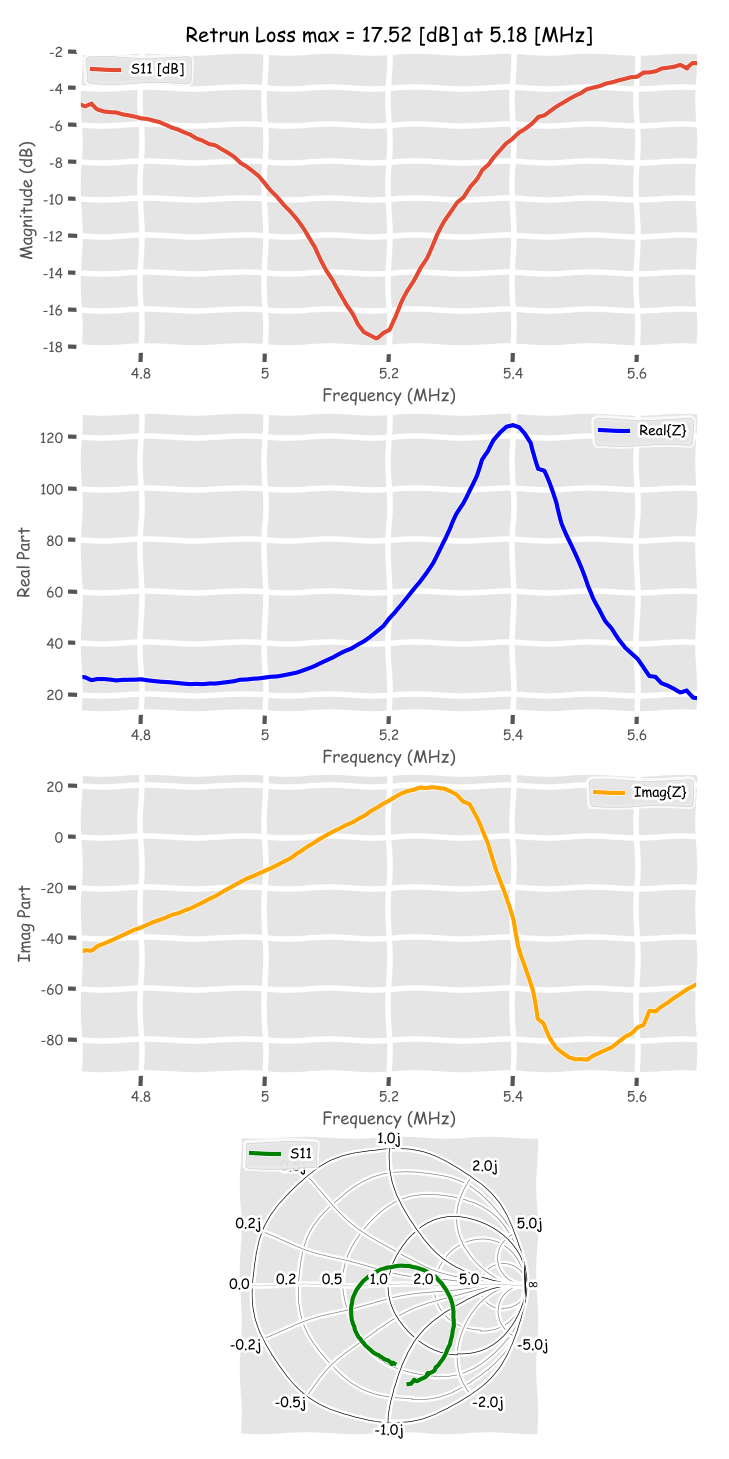
The second program reads a touchstone file and draw some graphs on the screen.

# scikit-rf.py

import matplotlib.pyplot as plt
import skrf as rf
from pylab import xkcd
import numpy as np

xkcd()
plt.style.use('ggplot')
plt.figure(figsize=(8, 18))

nwk = rf.Network('touchstone.s1p')

index = np.argmin(nwk.s_db)
fpeak = nwk.f[index] / 1000000 # fvector in Hz
rlmax = nwk.s_db[index, 0, 0]

plt.subplot(4, 1, 1)
nwk.plot_s_db(label='S11 [dB]', lw=3)
plt.title('Return Loss max = {0:.2f} dB at {1} [MHz]'.format(-rlmax, fpeak))
plt.grid(True)

plt.subplot(4, 1, 2)
nwk.plot_z_re(label='Real{Z}', color='blue', lw=3)
plt.grid(True)

plt.subplot(4, 1, 3)
nwk.plot_z_im(label='Imag{Z}', color='orange', lw=3)
plt.grid(True)

plt.subplot(4, 1, 4)
nwk.plot_s_smith(label='S11', draw_labels=True, color='green', lw=3)

plt.show()

The program is very simple thanks to the library scikit-rf.