
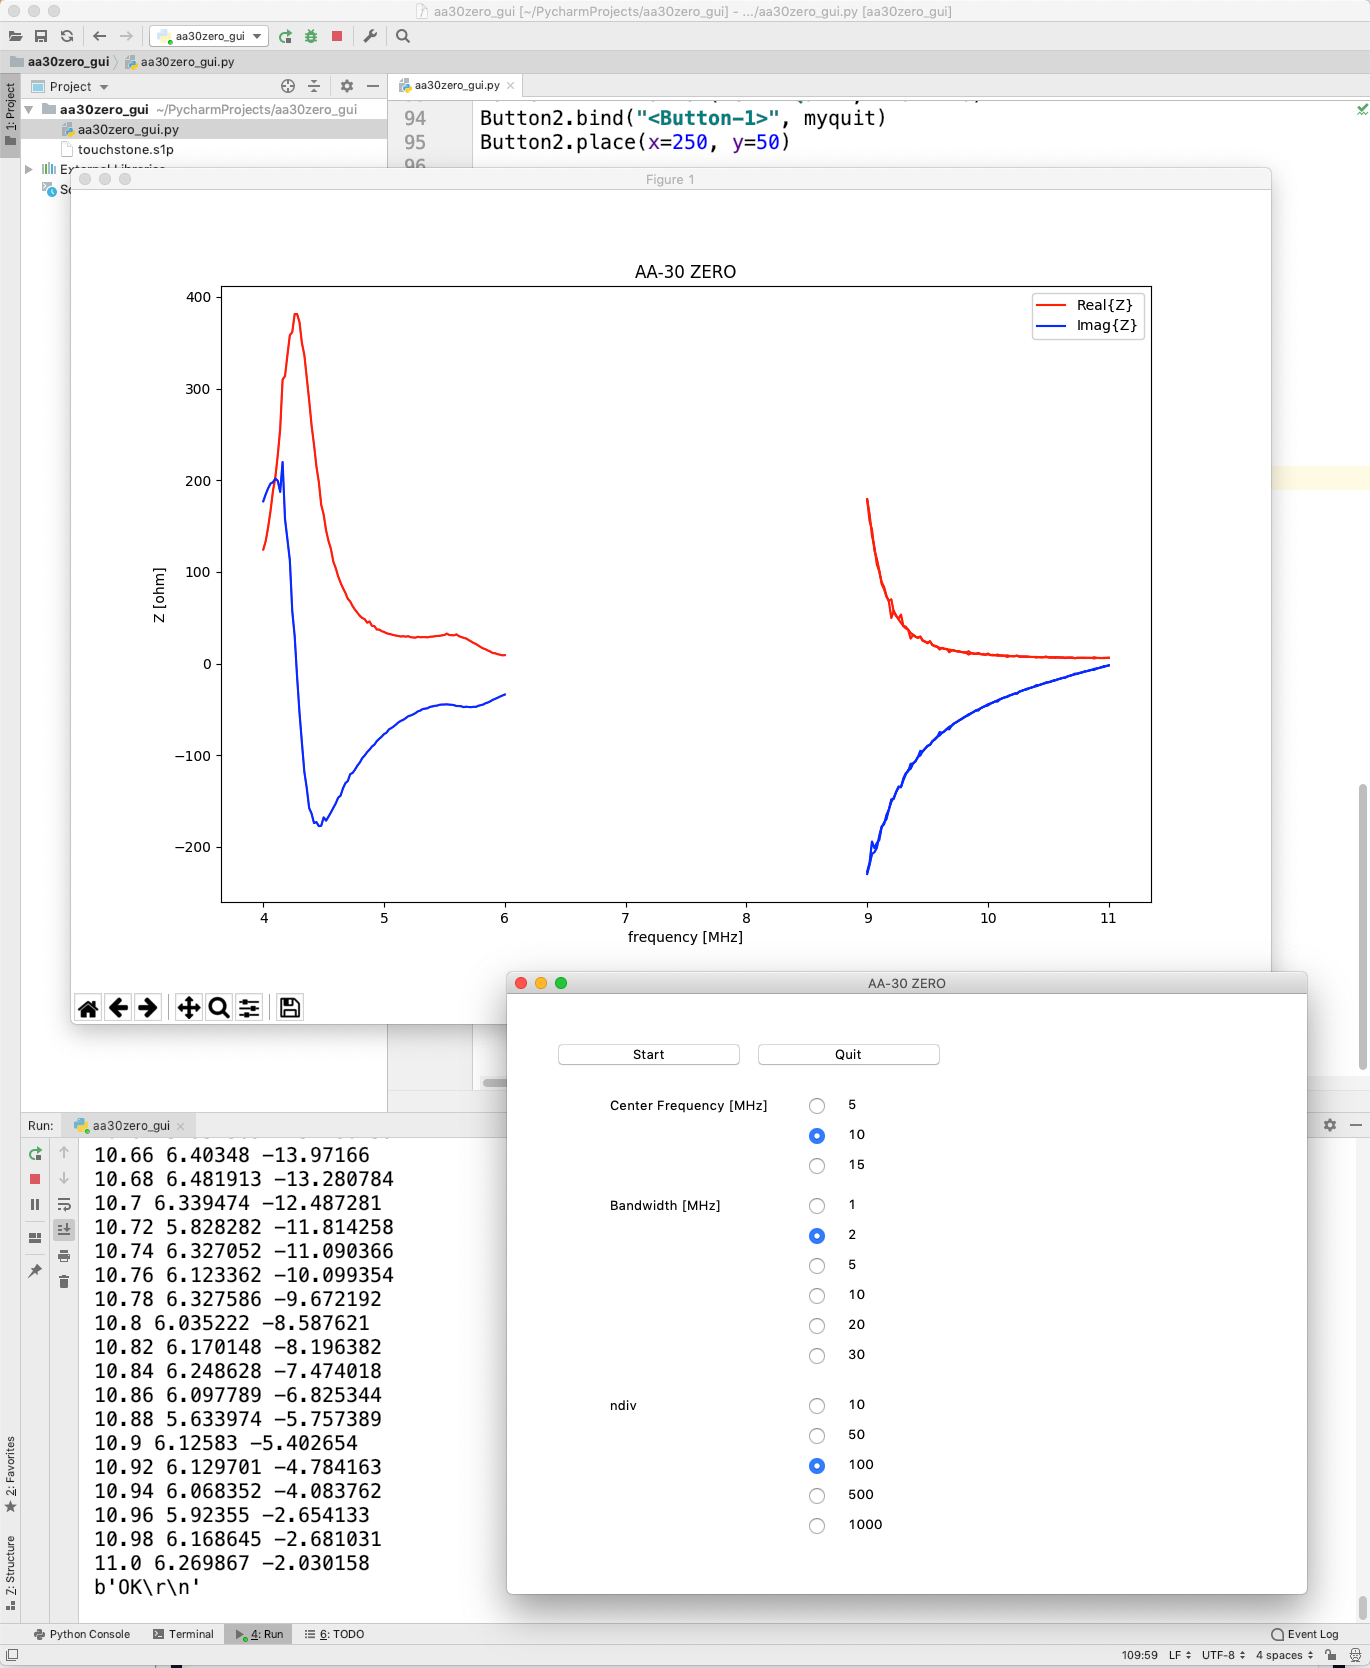
This is a GUI version of the program.
The Tkinter module is used to take care of the GUI part of the program.
You can repeat the measurement with different parameters, and plot the results onto the same graph.
# aa30zero_gui.py

import serial
import time
import sys
import tkinter as tk
import matplotlib.pyplot as plt


def mystart(event):
    print("clicked at", event.x, event.y, ", v = ", v0.get(), v1.get(), v2.get())
    measure(v0.get(), v1.get(), v2.get())


def myquit(event):
    print("quit at", event.x, event.y)
    sys.exit(0)


def measure(i0, i1, i2):
    f = open('touchstone.s1p', 'w')
    ser = serial.Serial('/dev/cu.usbmodem14701', 38400, timeout=1)
    print(ser.name)

    time.sleep(2)
    ser.write(b'ver' + b'\x0a')

    time.sleep(1)
    ser.write(b'fq' + str(freq_list[i0]).encode('ASCII') + b'000000' + b'\x0a')

    time.sleep(1)
    ser.write(b'sw' + str(bw_list[i1]).encode('ASCII') + b'000000' + b'\x0a')

    for i in range(3):
        line = ser.readline()
        print(line)

    time.sleep(1)
    ser.write(b'frx' + str(ndiv_list[i2]).encode('ASCII') + b'\x0a')

    f.write('# MHz S RI R 50 \n')

    z0 = complex(50.0, 0.0)
    ff_list = []
    zr_list = []
    zi_list = []

    for i in range(int(ndiv_list[i2]) + 1):
        line = ser.readline().decode(encoding='utf-8').rstrip().split(',')
        freq = float(line[0])
        z = complex(float(line[1]), float(line[2]))
        rho = (z - z0) / (z + z0)
        ff_list.append(freq)
        zr_list.append(z.real)
        zi_list.append(z.imag)
        print(freq, z.real, z.imag)
        f.write('{0} {1} {2} \n'.format(freq, rho.real, rho.imag))

    for i in range(1):
        line = ser.readline()
        print(line)

    ser.close()

    plt.figure(1, figsize=(12, 8))
    plt.plot(ff_list, zr_list, 'r-', label='Real{Z}')
    plt.plot(ff_list, zi_list, 'b-', label='Imag{Z}')

    global plt_count
    if plt_count == 0:
        plt.legend()
        plt.xlabel('frequency [MHz]')
        plt.ylabel('Z [ohm]')
        plt.title("AA-30 ZERO")
    plt_count += 1
    plt.show()


plt_count = 0

freq_list = [5, 10, 15]
bw_list = [1, 2, 5, 10, 20, 30]
ndiv_list = [10, 50, 100, 500, 1000]

root = tk.Tk()
root.title('AA-30 ZERO')
root.geometry('800x600')

Button = tk.Button(text='Start', width=20)
Button.bind("<Button-1>", mystart)
Button.place(x=50, y=50)

Button2 = tk.Button(text='Quit', width=20)
Button2.bind("<Button-1>", myquit)
Button2.place(x=250, y=50)

v0 = tk.IntVar()
v0.set(0)
tk.Label(root, text='Center Frequency [MHz]').place(x=100, y=100)
for index, value in enumerate(freq_list):
    tk.Radiobutton(root,
                   text=value,
                   padx=20,
                   variable=v0,
                   value=index).place(x=300, y=100 + 30 * index)

v1 = tk.IntVar()
v1.set(0)
tk.Label(root, text='Bandwidth [MHz]').place(x=100, y=200)
for index, value in enumerate(bw_list):
    tk.Radiobutton(root,
                   text=value,
                   padx=20,
                   variable=v1,
                   value=index).place(x=300, y=200 + 30 * index)
v2 = tk.IntVar()
v2.set(0)

tk.Label(root, text='ndiv').place(x=100, y=400)
for index, value in enumerate(ndiv_list):
    tk.Radiobutton(root,
                   text=value,
                   padx=20,
                   variable=v2,
                   value=index).place(x=300, y=400 + 30 * index)

root.mainloop()
sys.exit(0)