
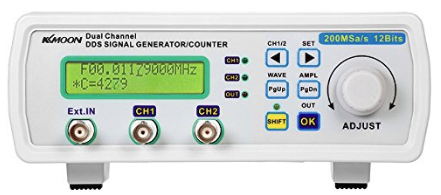
My signal generator can be controlled with a PC using its USB I/F.
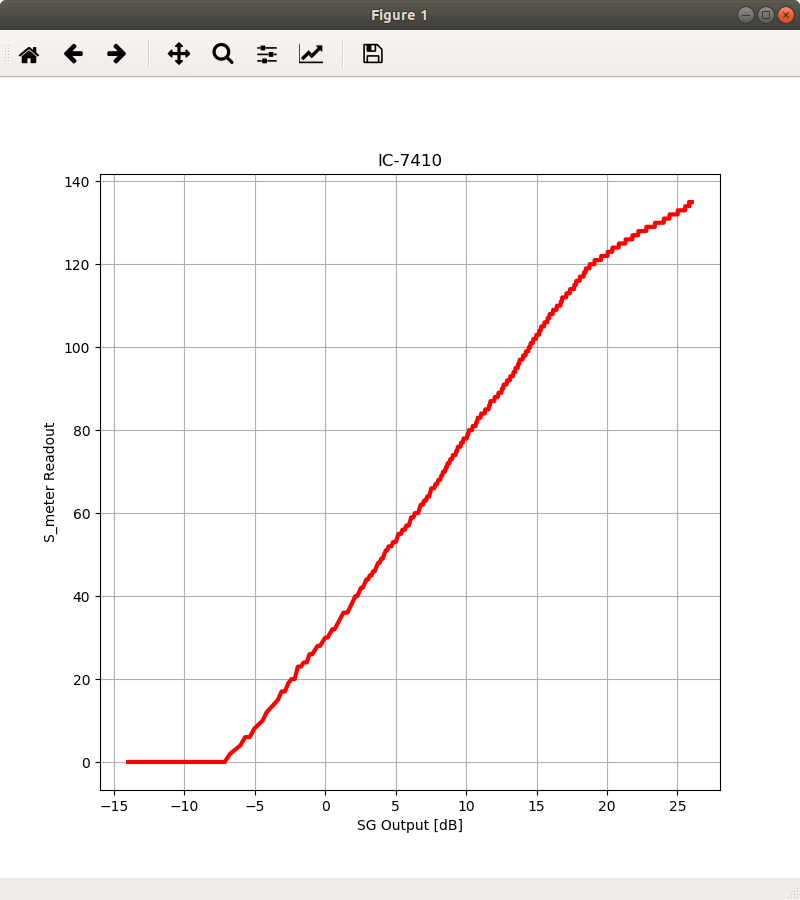
The graph shows the S_meter readout of IC-7410 when the output level of the SG is varied from 0.2 Vpp to 20 Vpp with the step size of 20 mVpp.
Note that the signal is not directly connected, but only loosely coupled.
The readout should be 000 for S0, 120 for S9, and 240 for S9+60dB, according to the equipment manual.
import sys
import math
from time import sleep
import numpy as numpy
import matplotlib.pyplot as plt
import serial

ser_sg = serial.Serial('/dev/ttyUSB0', 57600, timeout=1) # signal generator
ser_rx = serial.Serial('/dev/ttyUSB1', 19200, timeout=1) # receiver

ser_sg.write(b':\n')
s = ser_sg.read(99)
print('[:]              ', s)

ser_sg.write(b':r0c\n')
s = ser_sg.read(99)
print('[:r0c]           ', s)

ser_sg.write(b':r1c\n')
s = ser_sg.read(99)
print('[:r1c]           ', s)

ser_sg.write(b':r2c\n')
s = ser_sg.read(99)
print('[:r2c]           ', s)

ser_sg.write(b':s1f0701500000\n')
s = ser_sg.read(99)
print('[:s1f0701500000] ', s)

ser_sg.write(b':r1f\n')
s = ser_sg.read(99)
print('[r1f]            ', s)

ser_sg.write(b':s1a020\n')
s = ser_sg.read(99)
print('[s1a0123]        ', s)

ser_sg.write(b':r1a\n')
s = ser_sg.read(99)
print('[r1a]            ', s)

freq_10hz = 701500
hz10   = freq_10hz           % 10
hz100  = freq_10hz //     10 % 10
khz    = freq_10hz //    100 % 10
khz10  = freq_10hz //   1000 % 10
khz100 = freq_10hz //  10000 % 10
mhz    = freq_10hz // 100000 % 10

set_freq = b'\xfe\xfe\x80\xe0\x05'     \
		+bytes([16*hz10        ])      \
		+bytes([16*khz   +hz100])      \
		+bytes([16*khz100+khz10])      \
		+bytes([          mhz  ])      \
		+b'\x00\xfd'
ser_rx.write(set_freq)
data1 = ser_rx.read(18) # not 17 to raise timeout

xvalue = []
yvalue = []

for amp_10mv in range(20, 2002, 2):
	stramp = str(amp_10mv)
	set_amp = b':s1a'+bytes(stramp.encode())+b'\n'
	print(amp_10mv, stramp, bytes(stramp.encode()), set_amp)
	ser_sg.write(set_amp)
	sleep(0.5)

	get_Smeter = b'\xfe\xfe\x80\xe0\x15\x02\xfd'
	ser_rx.write(get_Smeter)
	data2 = ser_rx.read(16)
	signal = int( data2.hex()[26:30] )
	amp = amp_10mv/100.0
	ampdB = 20.0 * math.log10(amp)
	xvalue.append(ampdB)
	yvalue.append(signal)
	print(amp, ampdB, signal)

ser_sg.close()
ser_rx.close()

plt.figure(1, figsize=(8,8))
plt.subplot(111)
plt.grid(True)
plt.plot(xvalue, yvalue, color='red', linewidth=3)
plt.title('IC-7410')
plt.xlabel('SG Output [dB]')
plt.ylabel('S_meter Readout')
plt.show()