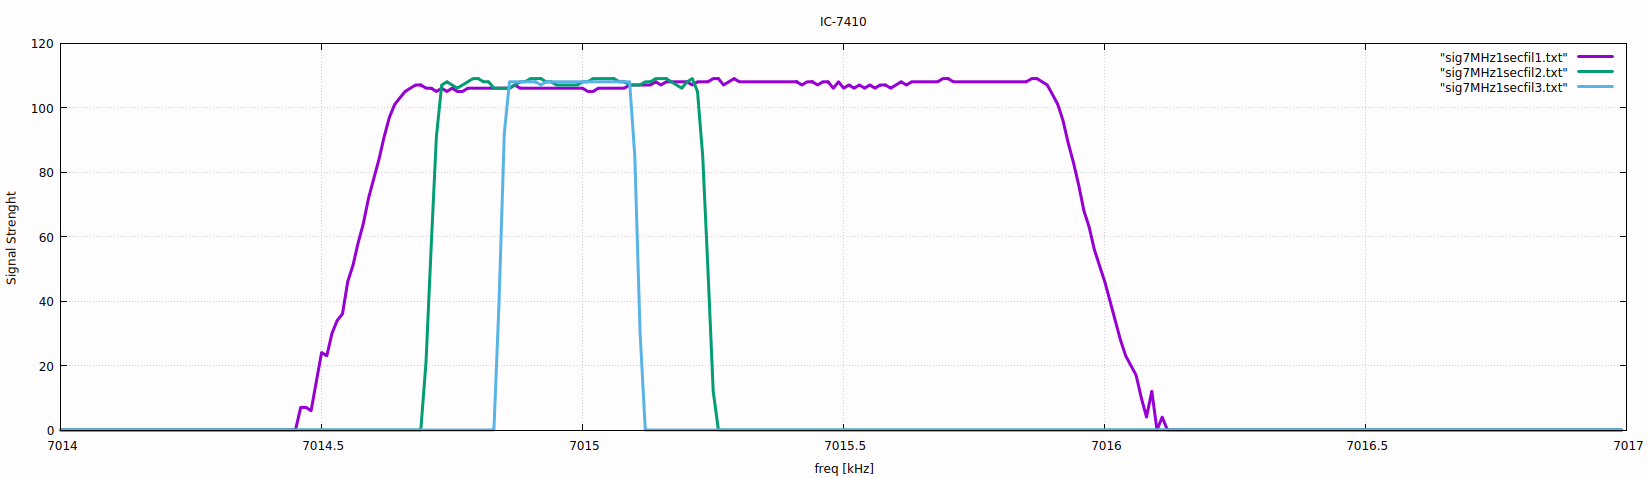
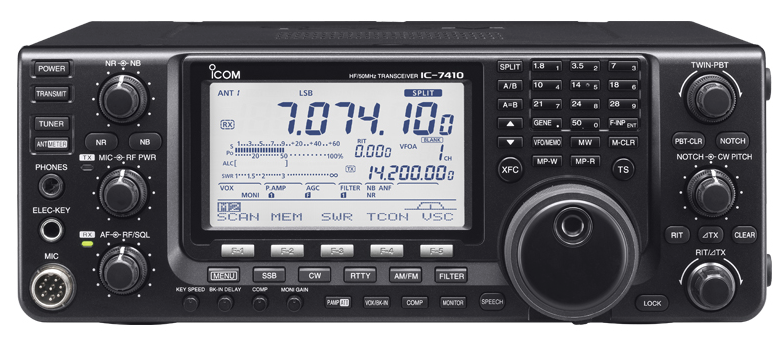
With a signal generator, you can measure the characteristics of your IF filters.
The output of the signal generator, 7015kHz CW, is loosely coupled to IC-7410, and the signal strength is observed while tuning the receiver from 7014kHz to 7016.5kHz with the step size of 100Hz.
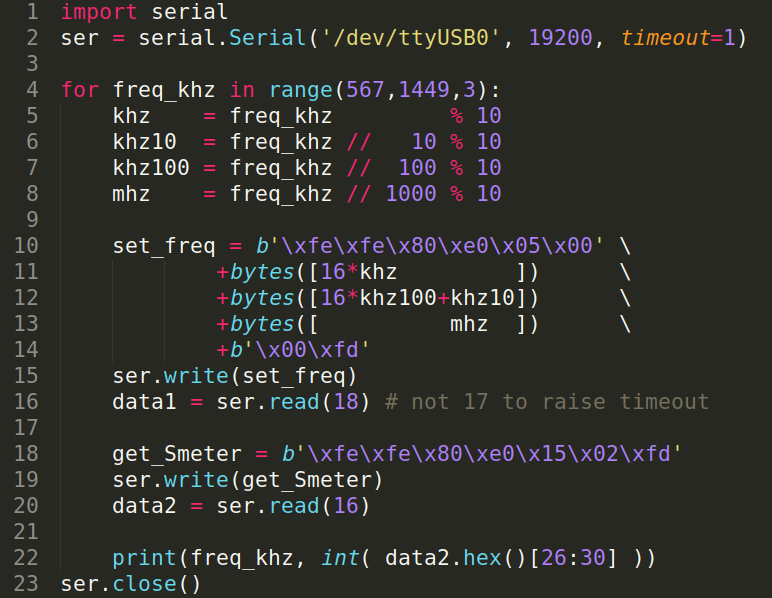
import sys
import numpy as numpy
import matplotlib.pyplot as plt
import serial

ser = serial.Serial('/dev/ttyUSB0', 19200, timeout=1)

xvalue = []
yvalue = []

for freq_10hz in range(701400, 701650, 1):
	hz10   = freq_10hz           % 10
	hz100  = freq_10hz //     10 % 10
	khz    = freq_10hz //    100 % 10
	khz10  = freq_10hz //   1000 % 10
	khz100 = freq_10hz //  10000 % 10
	mhz    = freq_10hz // 100000 % 10

	set_freq = b'\xfe\xfe\x80\xe0\x05'     \
			+bytes([16*hz10        ])      \
			+bytes([16*khz   +hz100])      \
			+bytes([16*khz100+khz10])      \
			+bytes([          mhz  ])      \
			+b'\x00\xfd'
	ser.write(set_freq)
	data1 = ser.read(18) # not 17 to raise timeout

	get_Smeter = b'\xfe\xfe\x80\xe0\x15\x02\xfd'
	ser.write(get_Smeter)
	data2 = ser.read(16)
	signal = int( data2.hex()[26:30] )
	freq = freq_10hz/100.0
	xvalue.append(freq)
	yvalue.append(signal)
	print(freq, signal)

ser.close()

plt.figure(1, figsize=(8,8))
plt.subplot(111)
plt.grid(True)
plt.plot(xvalue, yvalue, color='red', linewidth=3)
plt.show()
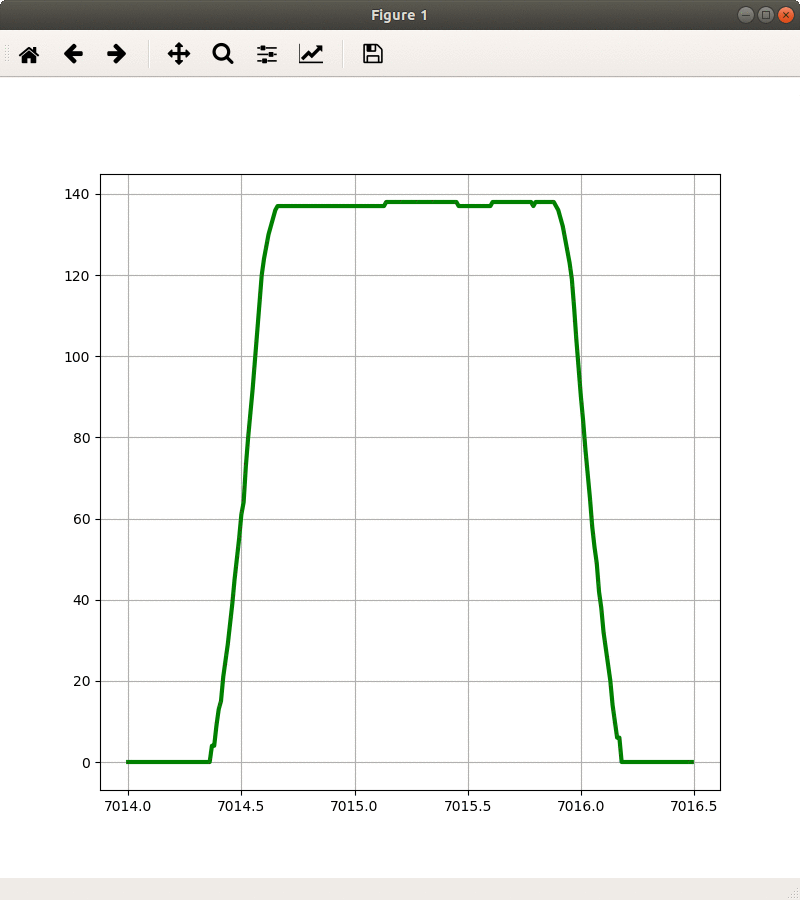
The receiver has three difital IF filters, each with presettable bandwidth. The graph shows my current settings.