
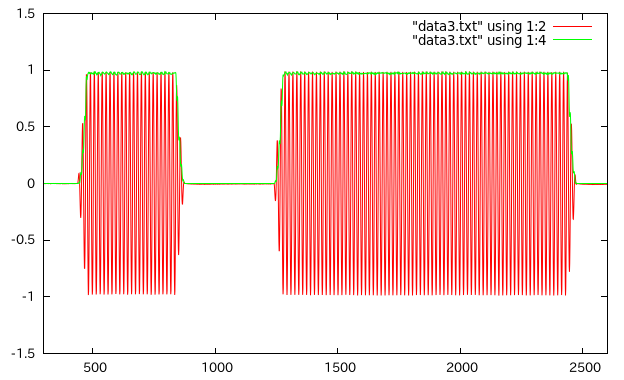
A side-tone signal (500Hz) for the letter “A”, and its envelope.
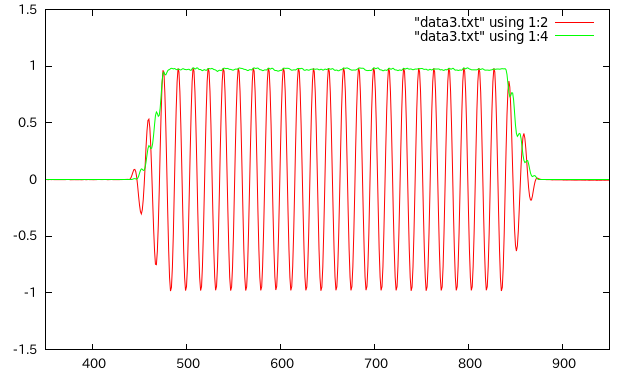
The sampling frequency is 8kHz, 16 times the side-tone frequency, and the envelope is computed as:
env(nT) = x(nT)^2 + x((n-4)T)^2
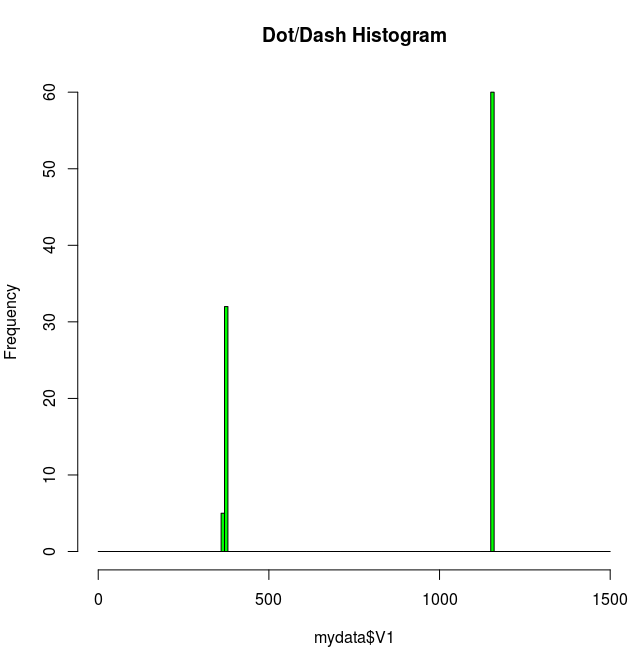
This is a histogram when the ASCII code string for “CQ CQ CQ de …” is sent to the rig (IC-7410) from Logger32 via USB I/F.
% R
> mydata<-read.table("H.txt")
> mydata
     V1
1  1159
2   376
3  1159
4   375
5  1159
> th=seq(0,1500,10)
> hist(mydata$V1,xlim=c(0,1500),breaks=th,main="Dot/Dash Histogram",col="green")
> dash=subset(mydata$V1,mydata$V1>750)
> mean(dash)
[1] 1158.167
> sd(dash)
[1] 2.084378
> dot=subset(mydata$V1,mydata$V1<750)
> mean(dot)
[1] 374.5946
> sd(dot)
[1] 2.127328
> length(dash)
[1] 60
> length(dot)
[1] 37
> mean(dash)/mean(dot)
[1] 3.091787
The dot-to-dash ratio does not become exactly 3.0, because some systematic offset is introduced to both length when quantizing the envelope.