Plot IQ signals from Airspy HF+ (2)

Now, trying to use PyQtGraph.

What is PyQtGraph?

PyQtGraph is a graphics and user interface library for Python that provides functionality commonly required in engineering and science applications. Its primary goals are 1) to provide fast, interactive graphics for displaying data (plots, video, etc.) and 2) to provide tools to aid in rapid application development (for example, property trees such as used in Qt Designer).

Plot IQ signals from Airspy HF+

Let’s see if I can receive the IQ signals correctly with my Python program.

A weak CW signal is fed into Airspy HF+.

user1@Asrock ~ % airspyhf_rx -z -d -r stdout -f 7.025 -m on > iq.bin
user1@Asrock ~ % python3 airspyhf.py

There is a DC offset, but looks reasonable.

Host software for Airspy HF+

User mode driver for Airspy HF+ is offered here:
https://github.com/airspy/airspyhf

You can build the host software following the steps shown in the site, and you will get:

user1@Asrock ~ % ls -l /usr/local/bin/airspy*
-rwxr-xr-x 1 root root 17184 Jan  7 22:54 /usr/local/bin/airspyhf_gpio
-rwxr-xr-x 1 root root 17504 Jan  7 22:54 /usr/local/bin/airspyhf_info
-rwxr-xr-x 1 root root 16608 Jan  7 22:54 /usr/local/bin/airspyhf_lib_version
-rwxr-xr-x 1 root root 27320 Jan  7 22:54 /usr/local/bin/airspyhf_rx

Let’s try one of the tools.

user1@Asrock ~ % airspyhf_info
AirSpy HF library version: 1.4.2
S/N: ..........
Part ID: 0x00000001
Firmware Version: R1.00.00
Available sample rate: 768 kS/s

Another tool, airspyhf_rx, spits out IQ in 32 bit floating point format.

user1@Asrock ~ % airspyhf_rx -z -d -r stdout -f 0.810 -m on | csdr octave_complex_c 1024 120000 --2d | octave -i > /dev/null
airspyhf_rx
Frequency: -f 0.810000MHz (810000 Hz)
0.768000 MS/s IQ
Device Serial Number: ..........
Stop with Ctrl-C
Streaming at 0.768 MS/s
Streaming at 0.658 MS/s
Streaming at 0.680 MS/s
Streaming at 0.697 MS/s
Streaming at 0.711 MS/s
Streaming at 0.723 MS/s
Streaming at 0.732 MS/s
Streaming at 0.739 MS/s
Streaming at 0.745 MS/s
Streaming at 0.749 MS/s
Streaming at 0.753 MS/s

On the first line, CSDR is a command line tool to carry out DSP tasks for Software Defined Radio.

GNU octave is a scientific programming language with built-in plotting and visualization tools.

So what can I do with these IQ signals from Airspy HF+?

UDP audio stream from Gqrx (5)

Server side:

Airspy HF+ is connected to a Linux machine, and Gqrx is running here.


Client side:

WSJT-X is running on a macOS machine.

$ python3 gqrxUdp5.py


Find my related previous articles by:

Currently, we have four.

Gqrx remote control settings

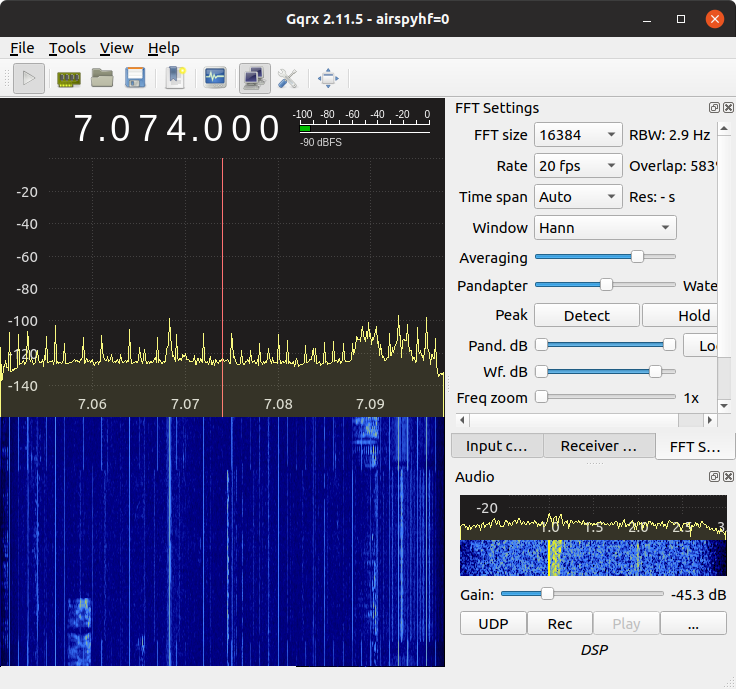
Gqrx can be controlled using a TCP connection.

http://gqrx.dk/doc/remote-control

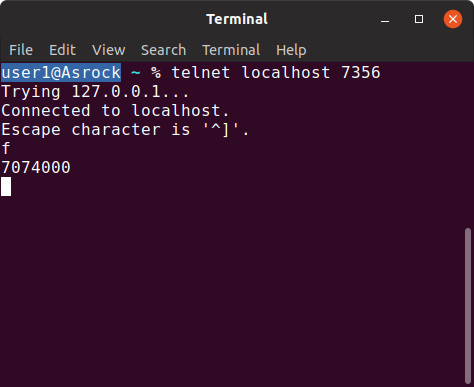
This is from a local host.

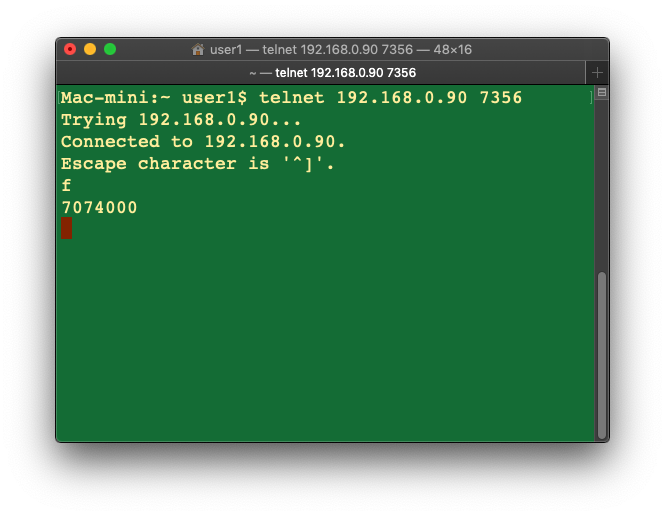
And this is from a remote host.

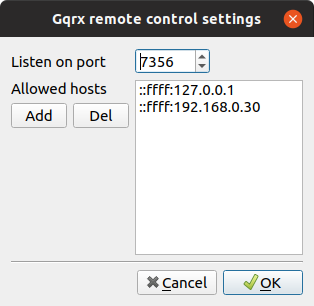
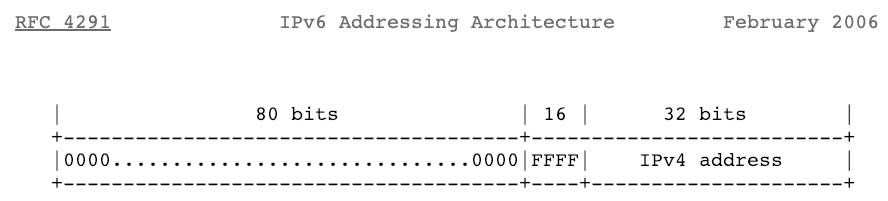
In both cases, you must give an IPv4-mapped IPv6 address to the remote control settings.

user1@Asrock ~/Downloads/gqrx-sdr-2.11.5
 % grep -r "ffff:127" .
./src/applications/gqrx/remote_control.cpp:#define DEFAULT_RC_ALLOWED_HOSTS   "::ffff:127.0.0.1"
user1@Asrock ~/Downloads/gqrx-sdr-2.11.5
 % grep -r "AF_INET" . 
user1@Asrock ~/Downloads/gqrx-sdr-2.11.5
 %

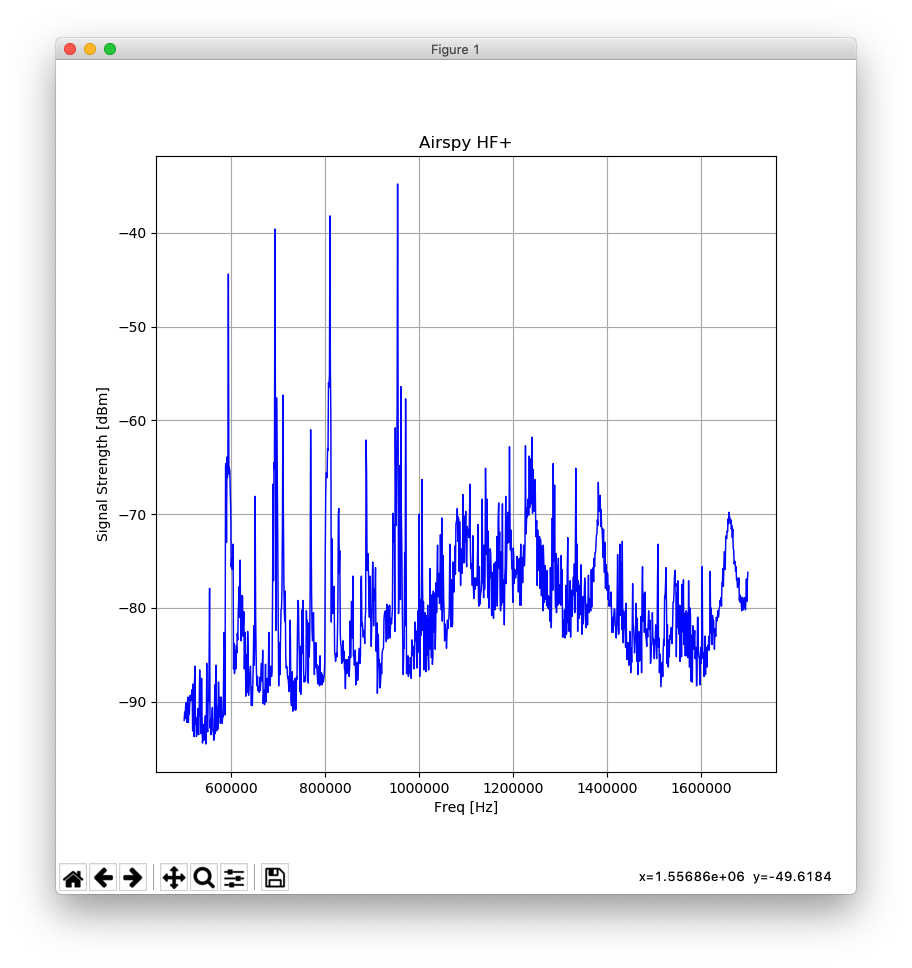
Here is an example Python program to control Airspy HF+ via Gqrx.

import numpy as numpy
import matplotlib.pyplot as plt
import telnetlib
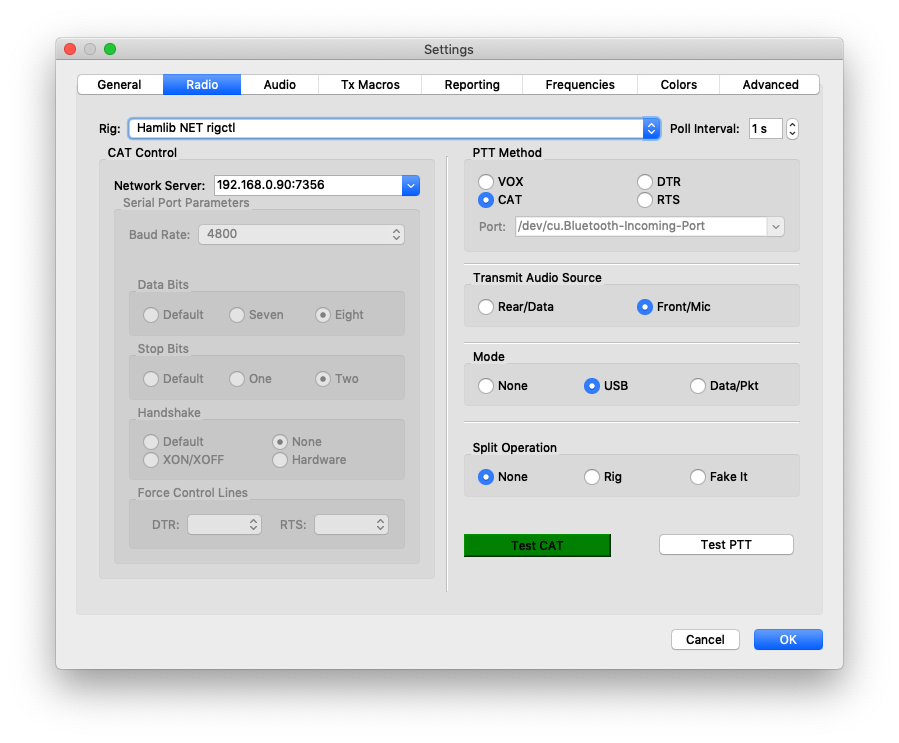
HOST = "192.168.0.90"
EXPECTED =b"dummy"
TOUT = 0.5

tn = telnetlib.Telnet(HOST, 7356)
xvalue = []
yvalue = []

tn.read_until(EXPECTED, timeout=TOUT*5)

tn.write(b"M CW 1000\n")
print(tn.read_until(EXPECTED, timeout=TOUT).decode('ascii'), end="")

for freq_hz in range(500000, 1700000, 1000):
	freq=b"F "+str(freq_hz).encode('ascii')+b"\n"
	tn.write(freq)
	tn.read_until(EXPECTED, timeout=TOUT)

	tn.write(b"f\n")
	f = int(tn.read_until(EXPECTED, timeout=TOUT).decode('ascii'))
	xvalue.append(f)
	print(f)

	tn.write(b"l\n")
	l = float(tn.read_until(EXPECTED, timeout=TOUT).decode('ascii'))
	yvalue.append(l)
	print(l)

plt.figure(1, figsize=(8,8))
plt.subplot(111)
plt.title('Airspy HF+')
plt.xlabel('Freq [Hz]')
plt.ylabel('Signal Strength [dBm]')
plt.grid(True)
plt.plot(xvalue, yvalue, color='blue', linewidth=1)
plt.show()