Now, trying to use PyQtGraph.
What is PyQtGraph?
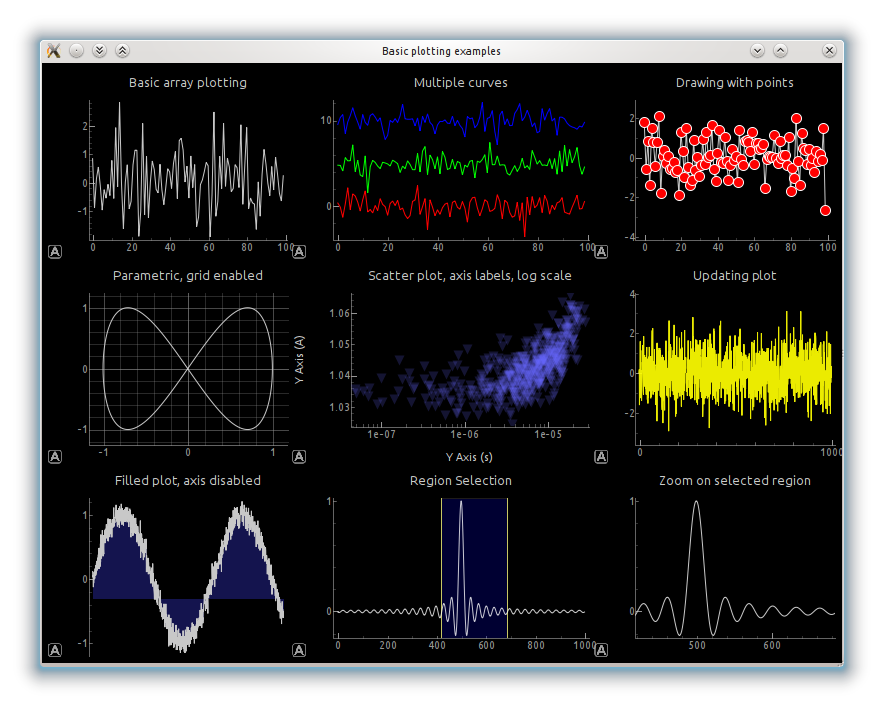
PyQtGraph is a graphics and user interface library for Python that provides functionality commonly required in engineering and science applications. Its primary goals are 1) to provide fast, interactive graphics for displaying data (plots, video, etc.) and 2) to provide tools to aid in rapid application development (for example, property trees such as used in Qt Designer).