
Measured timeout intervals using std::chrono.
bool MyDrawingAreaS::on_timeout() {
	current = chrono::system_clock::now();
	auto diff1 = current - start;
	auto diff2 = current - current_b4;
	current_b4 = current;
	cout << "MyDrawingAreaS::on_timeout(): elapsed time = " << chrono::duration_cast<std::chrono::milliseconds>(diff1).count()
             << " msec (delta = " << chrono::duration_cast<std::chrono::milliseconds>(diff2).count() << " msec),  count = "
             << count << ", nch = " << nch << endl;
% grep timer_value log.txt
SoundIC7410::SoundIC7410(): timer_value = 125
% grep "MyDrawingAreaS::on_timeout(): elapsed time" log.txt | head -1
MyDrawingAreaS::on_timeout(): elapsed time = 147 msec (delta = 147 msec), count = 2, nch = 1
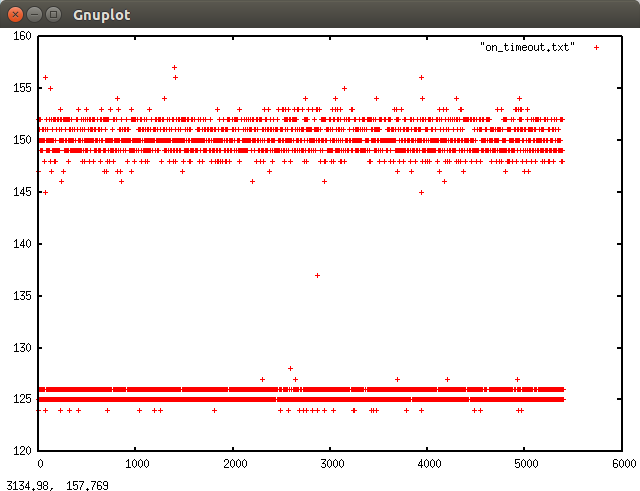
% grep "MyDrawingAreaS::on_timeout(): elapsed time" log.txt | awk '{print $9}' > on_timeout.txt
% gnuplot
> plot "on_timeout.txt"
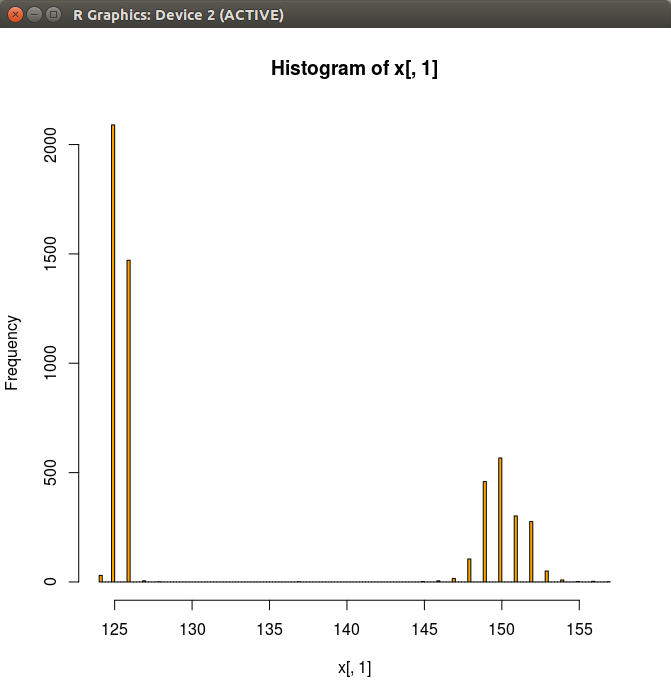
% R
> x<-read.csv("on_timeout.txt")
> hist(x[,1], col="orange", breaks=200)
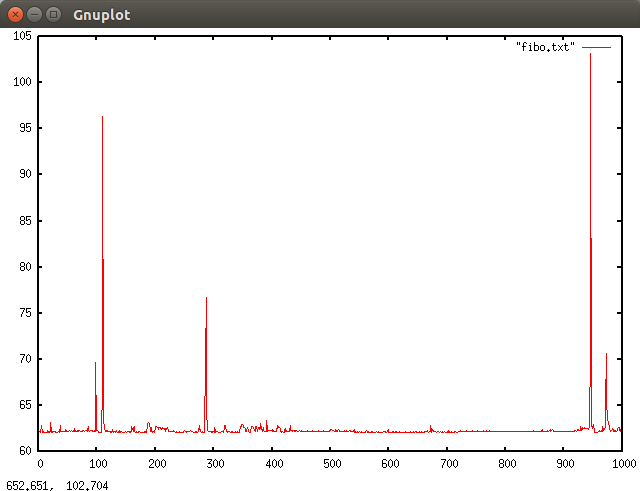
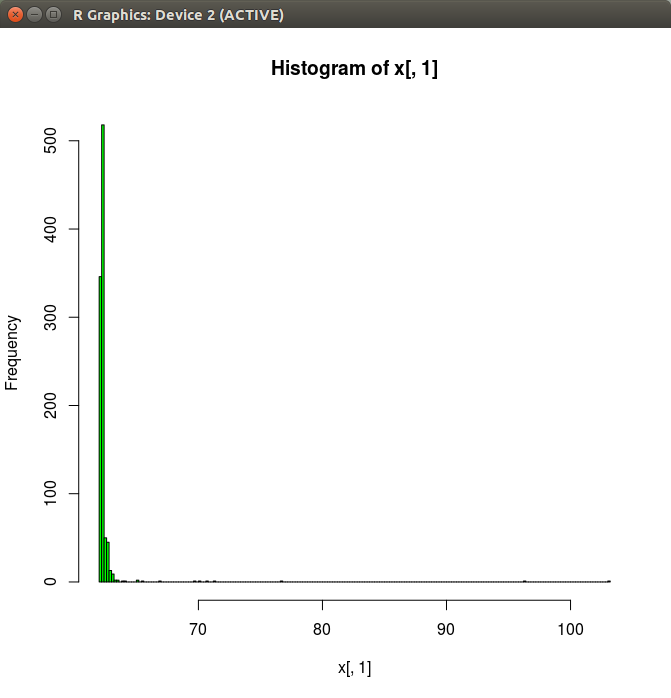
I do not know if the result is reasonable or not. With a very simple program like this:
#include <iostream>
#include <chrono>

void f(int n)
{
// lots of stuff
}

int main()
{
	std::chrono::time_point<std::chrono::system_clock> start, end, endb4;
	start = std::chrono::system_clock::now();
	endb4 = start;
	int n=35;
	for(int i=0;i<1000;i++) {
		f(n);
		end = std::chrono::system_clock::now();
		std::chrono::duration<double> elapsed_seconds = end-endb4;
		endb4 = end;
		if(i>0) std::cout <<  elapsed_seconds.count() << endl;
	}
}
we have the following results.
Please also see my previous articles: Timeout Intervals, and Timeout Intervals (2).