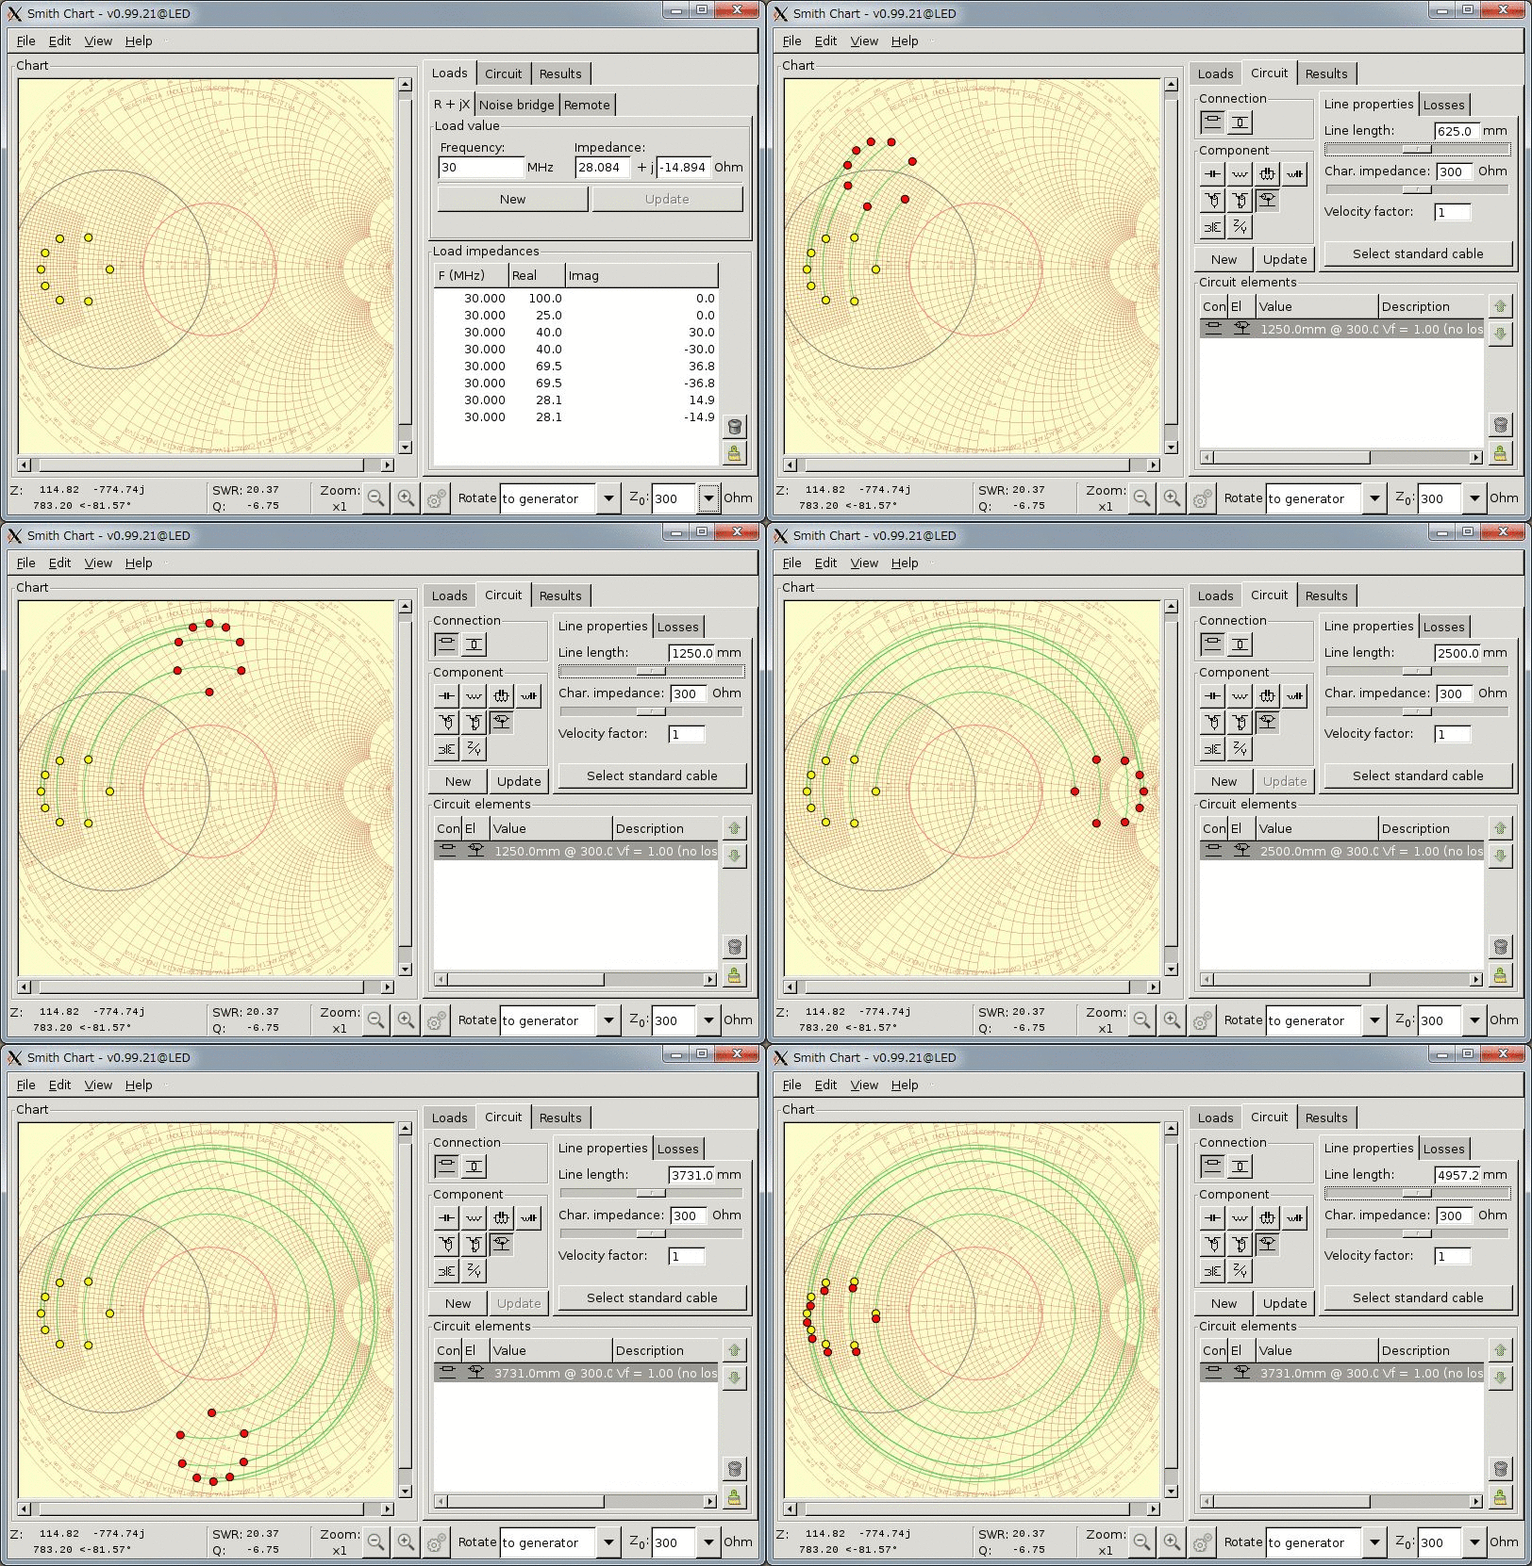
The loci (grenn circles) of Zin (red dots) may look weird, but this is only due to the fact that the system impedance of the Smith Chart here is set to 50 [ohm] and not to the characteristic impedance of the transmission line, which is 300 [ohm] in this case.
If you draw the same chart with the system impedance of 300 [ohm], you will now obtain the concentric circles, which you often see on a Smith Chart.
Note that the ZLs (yellow dots), which gives a VSWR value of 2 in a 50 [ohm] system, are much less than 300 [ohm], and now they appear on the left part of the chart.


