
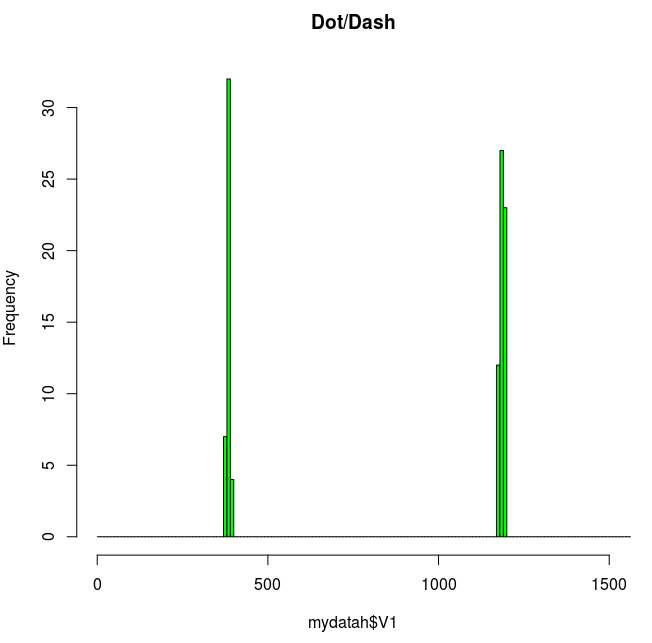
This is really my keying with K3NG Keyer. Quite naturally, dots and dashes are very exact.
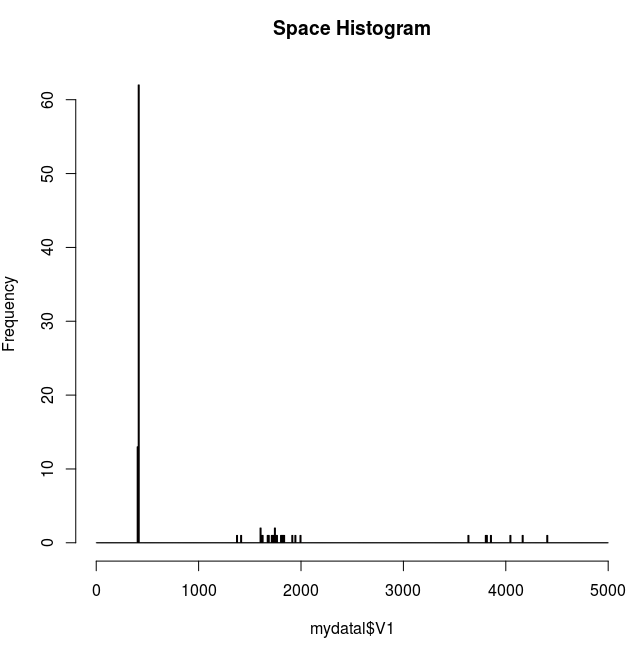
However, the space periods varis a lot, although the auto space feature of the keyer is ON.
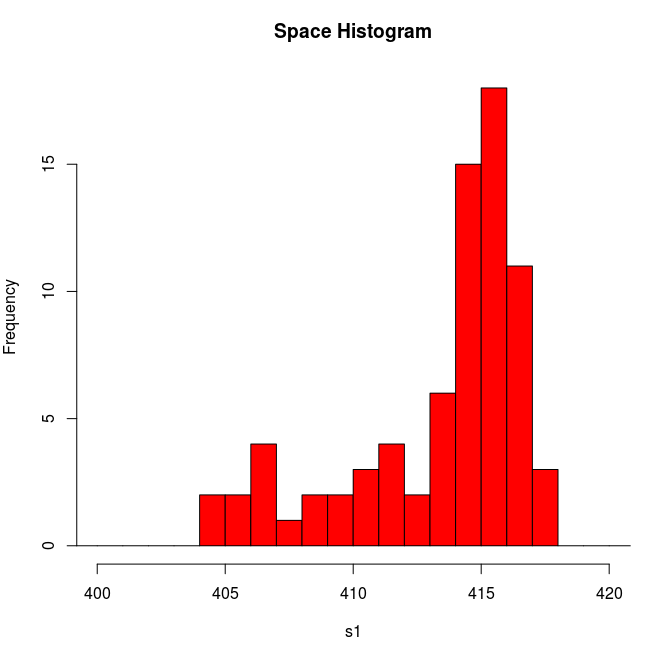
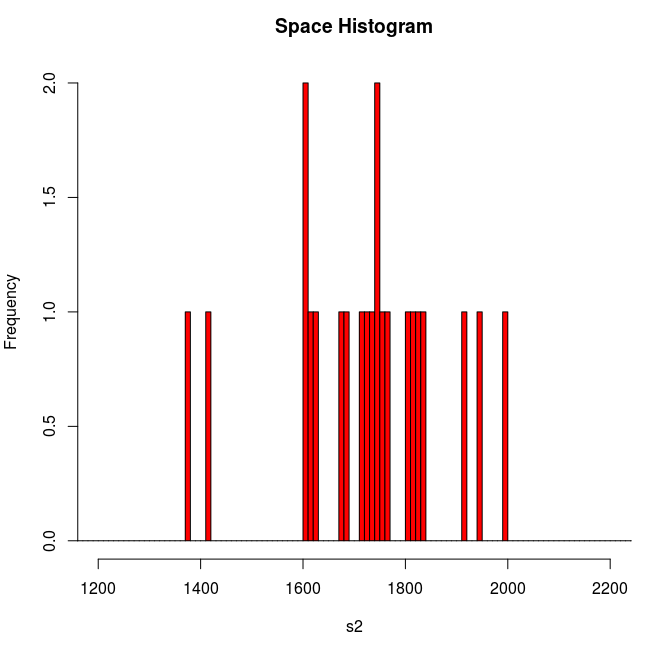
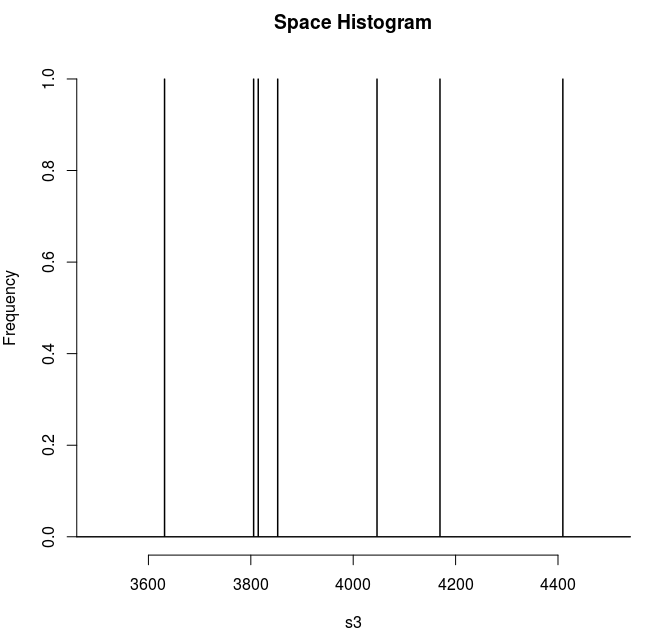
> th1=seq(0,5000,10)
> th2=seq(0,5000,1)
> hist(mydatal$V1,breaks=th1,col="red",main="Space Histogram")
> s1=subset(mydatal$V1,mydatal$V1<1000)
> s2=subset(mydatal$V1,mydatal$V1>1000 & mydatal$V1<3000)
> s3=subset(mydatal$V1,mydatal$V1>3000)
> mean(s1)
[1] 413.88
> mean(s2)
[1] 1723.409
> mean(s3)
[1] 3961.857
> mean(s2)/mean(s1)
[1] 4.164031
> mean(s3)/mean(s1)
[1] 9.572478
> mydatah<-read.table("K3ngCQhigh.txt")
> hist(mydatah$V1)
> hist(mydatah$V1,breaks=th1,main="Dot/Dash")
> hist(mydatah$V1,breaks=th1,main="Dot/Dash",xlim=c(0,1500))
> hist(mydatah$V1,breaks=th1,main="Dot/Dash",xlim=c(0,1500),col="green")
> dot=subset(mydatah$V1,mydatah$V1<750)
> dash=subset(mydatah$V1,mydatah$V1>750)
> mean(dot)
[1] 385.1395
> mean(dash)
[1] 1185.919
> mean(dash)/mean(dot)
[1] 3.079194
> hist(s1,xlim=c(400,420),breaks=th2,main="Space Histogram",col="red")
> hist(s2,breaks=th1,main="Space Histogram",col="red",xlim=c(1200,2200))
> hist(s3,breaks=th2,main="Space Histogram",col="red",xlim=c(3500,4500))
> sd(s1)
[1] 3.452222
> sd(s2)
[1] 149.9024
> sd(s3)
[1] 263.9188
> sd(dot)
[1] 4.033086
> sd(dash)
[1] 5.427007