
I removed the elements of my old dipole antenna for 17m band, and build a new dipole antenna for 40m band. The elements are Al wires with 1.5mm diameter, each around 10m length. Since I only have a limited space for my antennas, the far ends of the elements are folded in a weird manner.
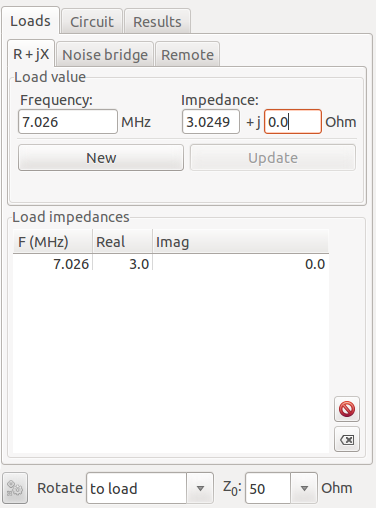
Impedance measurement results are:
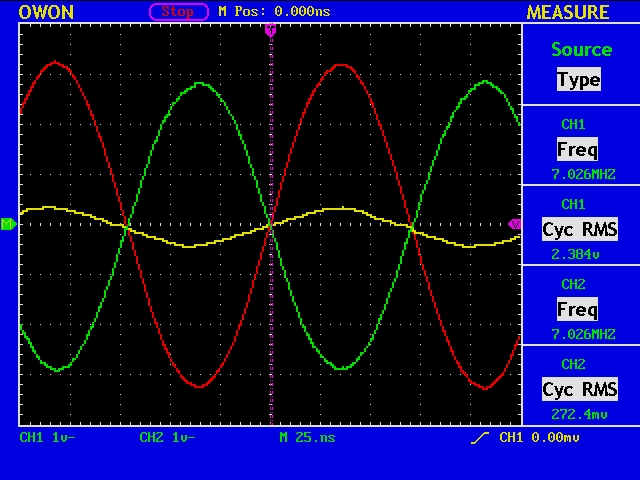
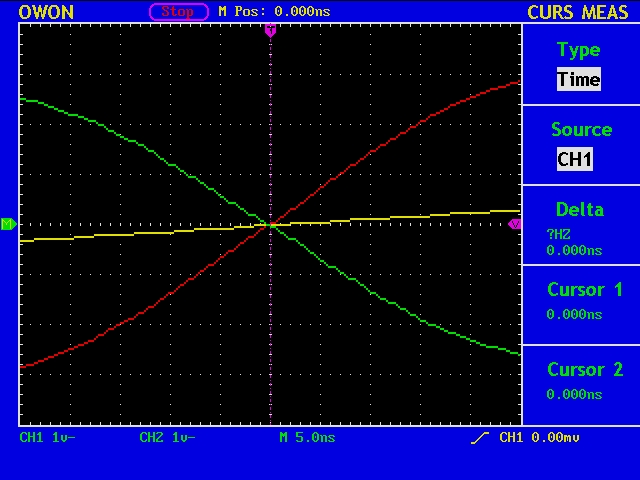
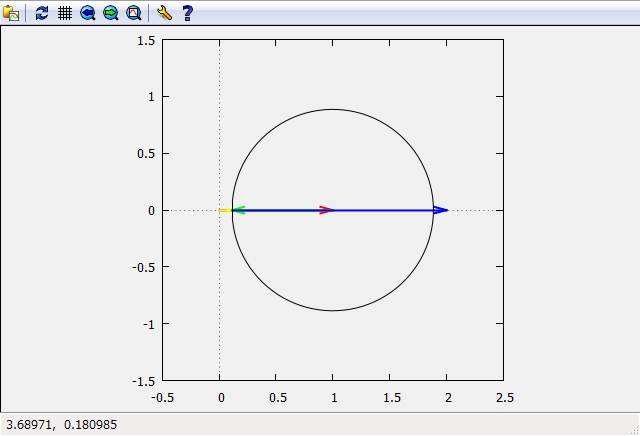
gnuplot> load gnuplot1.txt"
Freq [MHz]=7.026
V1=2.384
V2=0.272
Cursor 1=0.0
Cursor 2=0.0

vratio=0.114093959731544
phase1 [deg]=0.0
phase2 [deg]=0.0

abs(gamma)=0.885906040268456
swr=16.5294117647059
cz=3.02491103202847
# gnuplot1.txt
set object 1 rectangle from screen 0,0 to screen 1,1 fillcolor rgb "#f0f0f0" behind
set size square
set xrange[-0.5:2.5]
set yrange[-1.5:1.5]
set zeroaxis
set parametric

# input data from measurement
freq=7.026e6
v1=2.384
v2=0.272
cursor1=+0.000e-9
cursor2=+0.000e-9

vratio=v2/v1
period=1/freq
phase1=2.0*pi*(cursor1/period)
phase2=2.0*pi*(cursor2/period)
phasedeg1=360*(cursor1/period)
phasedeg2=360*(cursor2/period)

I={0,1}
z0=50.0
cv1=1+I*0;
cv2=vratio*(cos(phase1)+I*sin(phase1))
cvfwd=cv1
cvrfl=cv2-cv1
cvr=2*cv1-cv2
cz=z0*(cv2/cvr)
gamma=cvrfl/cvfwd
swr=(1+abs(gamma))/(1-abs(gamma))

print "Freq [MHz]=", freq/1e6
print "V1=", v1
print "V2=", v2
print "Cursor 1=", cursor1
print "Cursor 2=", cursor2
print ""
print "vratio=", vratio
print "phase1 [deg]=", phasedeg1
print "phase2 [deg]=", phasedeg2
print ""
print "abs(gamma)=", abs(gamma)
print "swr=", swr
print "cz=", cz

set arrow 1 from 0,0 to 1,0 lw 2 lt 1
set arrow 2 from 0,0 to 2,0 lw 1 lt -1
set arrow 3 from 0,0 to real(cv2),imag(cv2) lw 2 lt 6
set arrow 4 from 1,0 to real(cv2),imag(cv2) lw 2 lt 2
set arrow 5 from real(cv2),imag(cv2) to 2,0 lw 2 lt 3
plot [0:2*pi] 1+abs(gamma)*cos(t),abs(gamma)*sin(t) lw 1 lt -1 notitle

pause -1
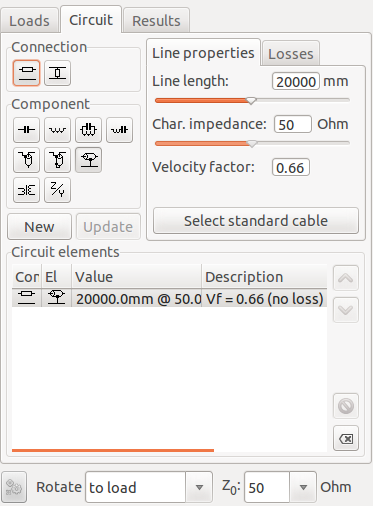
The length of the coax cable is about 20m, the same as before. Please also see my previou post,
Cable Lenght Measurement (5).
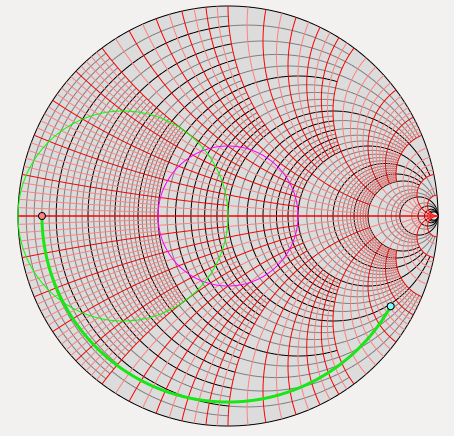
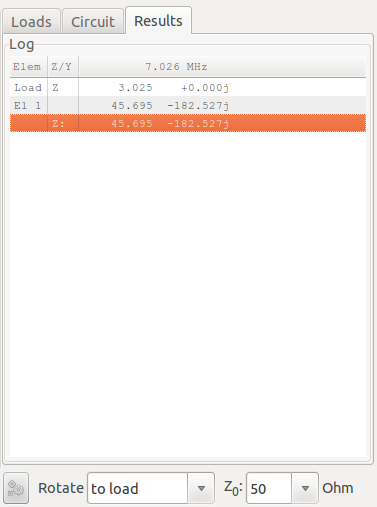
Considering the coax cable length, the antenna impedance shall be around Zant=45.695-182.527j [ohm]. Sounds reasonable?