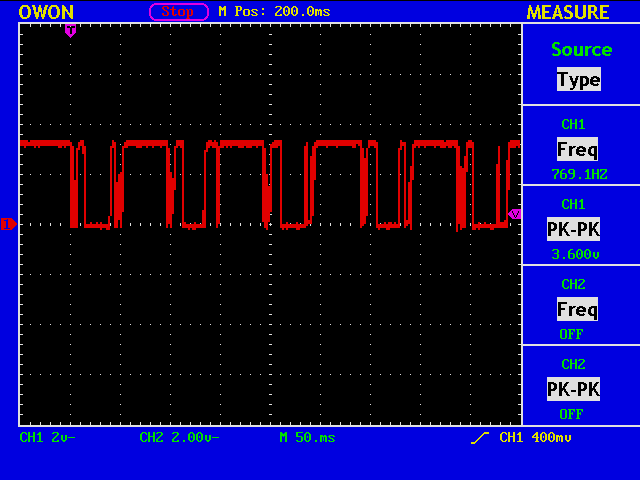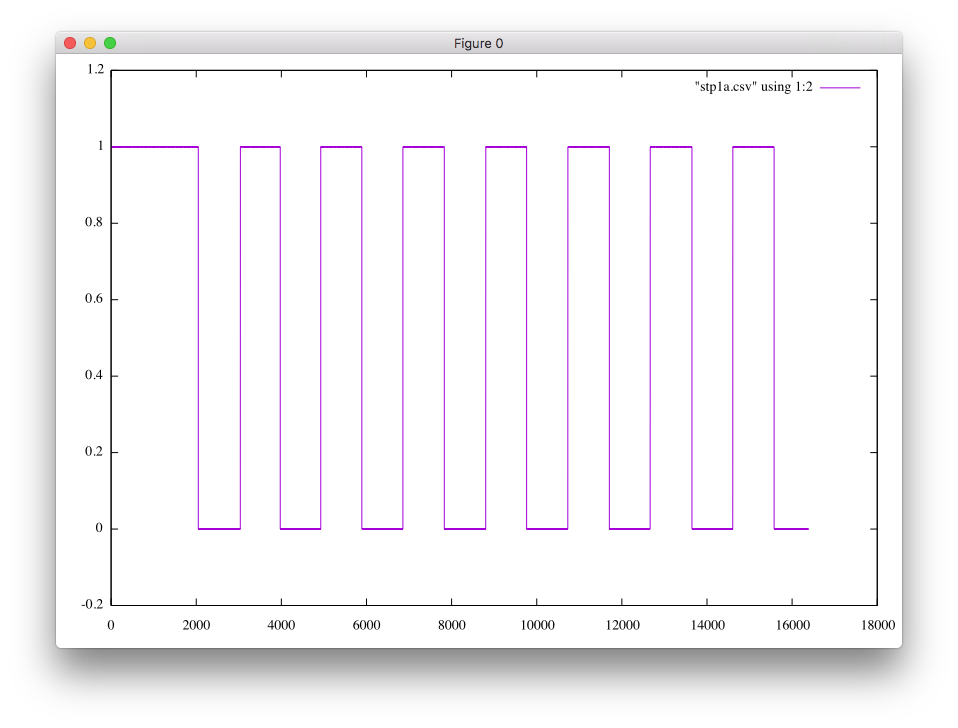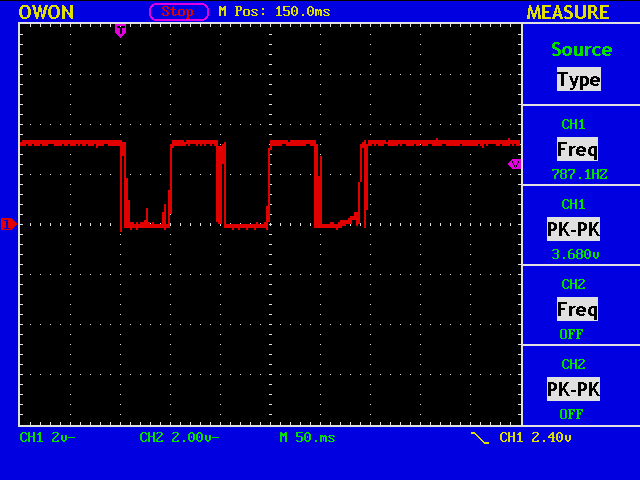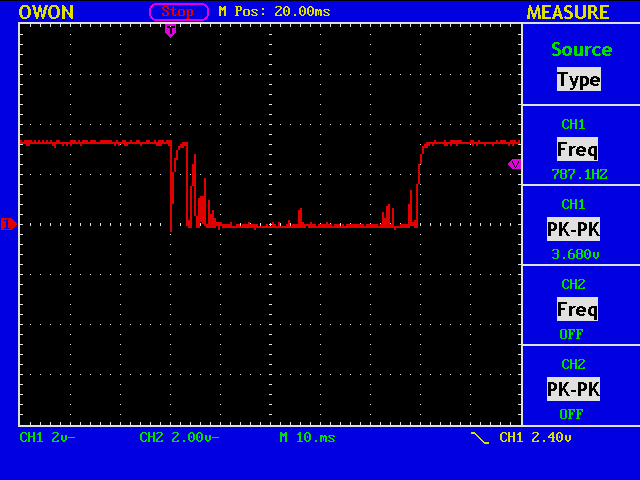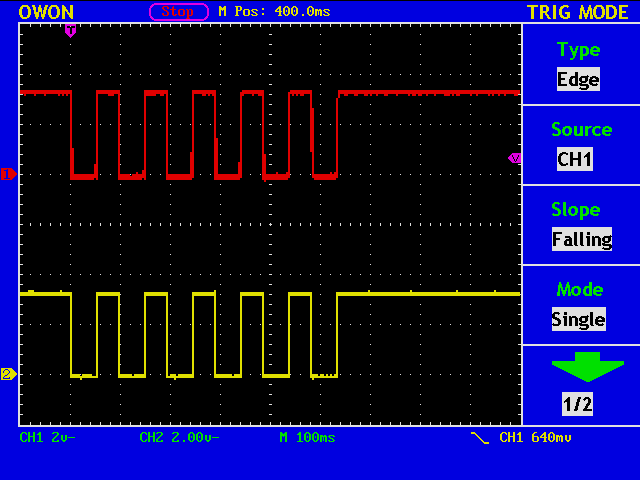
Now, we are sending six dots, the red trace showing the signal obtained at the dot contact, and the yellow trace out of a simple debounce circuit in an FPGA.
It is easy to include a counter in the device for measuring the length of marks and spaces.
![]()
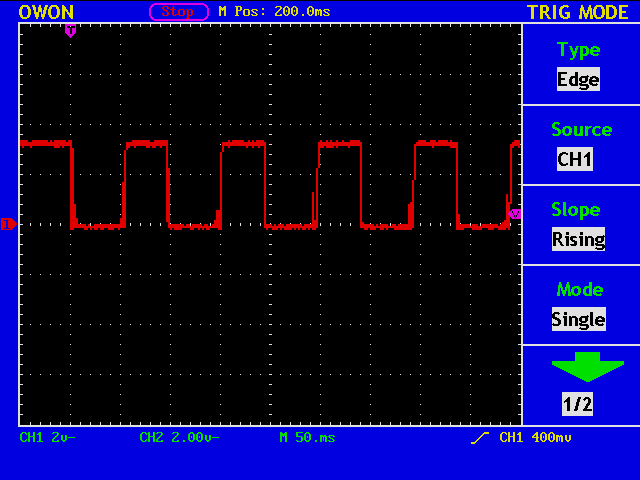
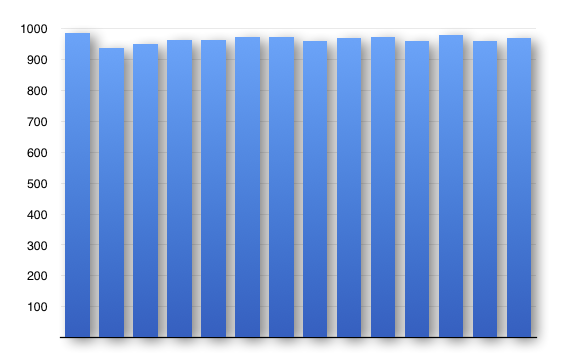
By manually reading the numbers in the above figure, you can write a short script in R.
% R
> dat_v=c(1034, 883, 1028, 889, 1003, 923, 1053, 871, 1024, 901, 1048)
> barplot(dat_v, col=c("blue", "green"))
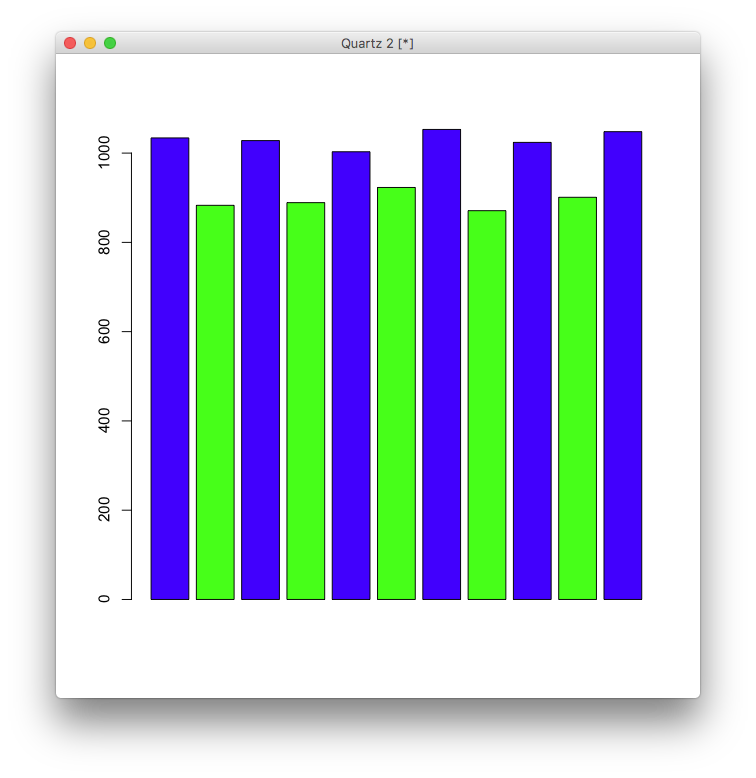
The blue bars correspond to the mark (=low) length, and the green ones to the space (=high). You will immediately notice that the mark to space ratio is not 1.0, and some more adjustment is required.