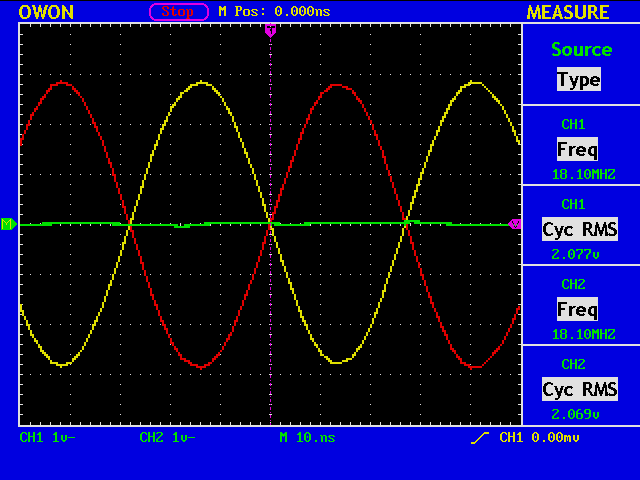
Checking the voltage at “V1” with both channels. CH2 (yellow) is inverted, and the green trace is CH1-CH2.
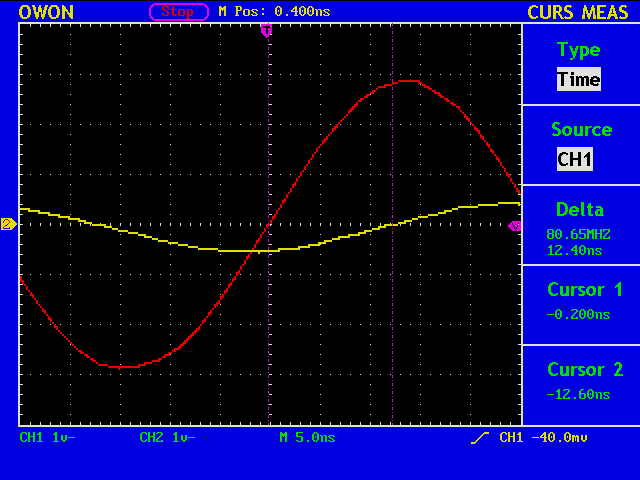
Checking the voltage at “V2”. The vertical gains of CH1 and CH2 differ 3.34dB.
OWON PDS5022S (fs=100MHz, 8-bit, 25MHz BW).

Ham Radio Blog
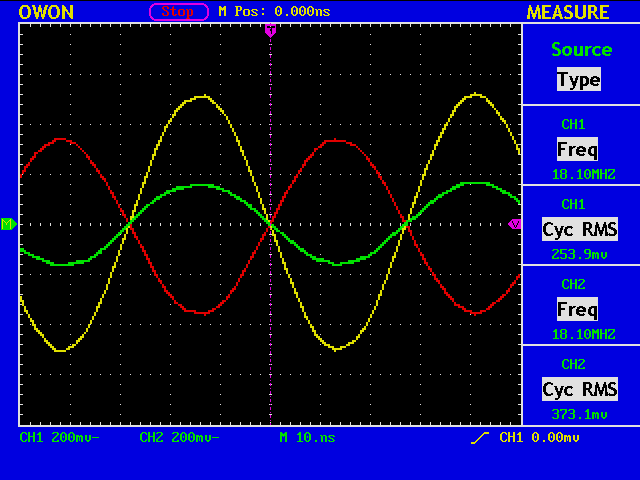
Checking the voltage at “V1” with both channels. CH2 (yellow) is inverted, and the green trace is CH1-CH2.
Checking the voltage at “V2”. The vertical gains of CH1 and CH2 differ 3.34dB.
OWON PDS5022S (fs=100MHz, 8-bit, 25MHz BW).
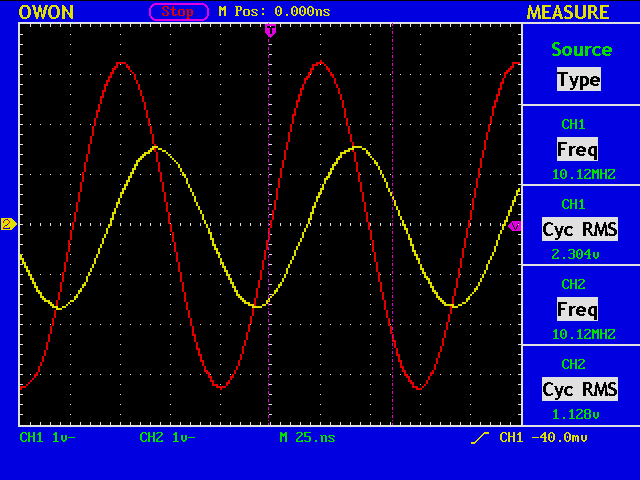
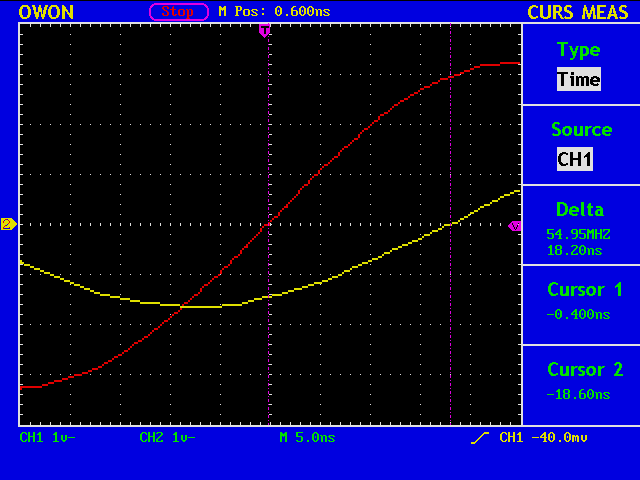
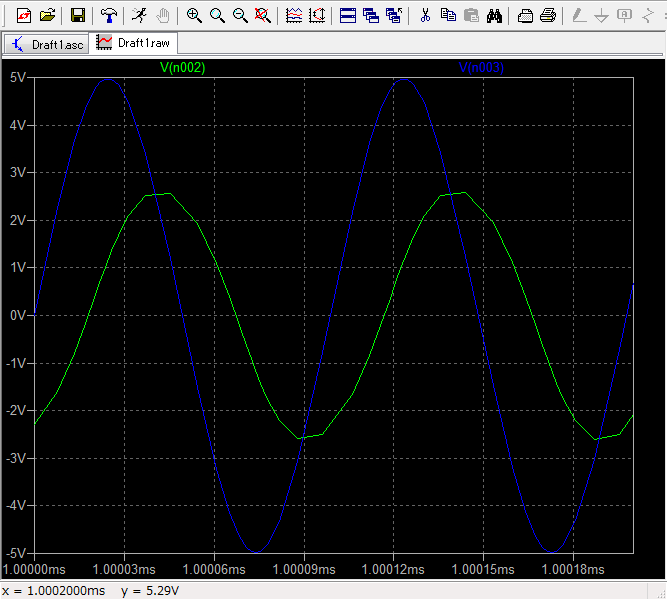
With the same DUT, the frequency of the SG is set to 10120kHz. The voltage ratio is V2/V1 = 1.128 [V] / 2.304 [V] = 0.4896. The phase difference is 18.20 [nS] / 98.81 [nS] * 360.0 = 66.31 [deg].
LTspice simulation at 10120kHz gives the volotage ratio of 2.56 [V] / 5.00 [V] = 0.512, and the phase difference of 17.7 [nS] / 98.81 [nS] * 360.0 = 64.48 [deg].
(%i1) Vs:1.0+%i*0.0;
(%i2) t:(-66.31/360.0)*2.0*%pi;
(%i3) s:0.4896/2;
(%i4) V2:s*(cos(t)+%i*sin(t));
(%i5) Vr:Vs-V2;
(%i6) z:50.0*(V2/Vr);
(%i7) float(realpart(z));
(%o7) 2.226027166429141
(%i8) float(imagpart(z));
(%o8) -12.98472809821215
(%i9) y:1/z;
(%i10) float(1/realpart(y));
(%o11) 77.96776398223048
(%i12) float(1/imagpart(y));
(%o12) 13.36634540341878
(%i13) float(1/(2.0*%pi*10120e3*(1/imagpart(y))));
(%o13) 1.1765948401104063*10^-9
With the same DUT, the frequency of the SG is set to 18100kHz. The voltage ratio is V2/V1 = 320.1 [mV] / 2.119 [V] = 0.1510. The phase difference is 12.40[nS] / 55.24[nS] * 360.0 = 80.81 [deg].

LTspice simulation at 18100kHz gives the volotage ratio of 1.58 [V] / 5.00 [V] = 0.316, and the phase difference of 11.6 [nS] / 55.24 [nS] * 360.0 = 75.60 [deg].

(%i1) Vs: 1.0+%i*0.0;
(%i2) t:(-80.81/360.0)*2.0*%pi;
(%i3) s:0.1510/2.0;
(%i4) V2:s*(cos(t)+%i*sin(t));
(%i5) Vr:Vs-V2;
(%i6) z:50.0*(V2/Vr);
(%i7) float(realpart(z));
(%o7) 0.32385259041389
(%i8) float(imagpart(z));
(%o8) -3.796459497712614
(%i9) y:1/z;
(%i10) float(1/realpart(y));
(%o10) 44.82899210266004
(%i11) float(1/imagpart(y));
(%o11) 3.824085368706621
(%i12) float(1/(2.0*%pi*18100e3*(1/imagpart(y))));
(%o12) 2.2993970925737322*10^-9
From the measured parameters that the voltage ratio V2/V1 is 0.698 and the phase difference is -57.7 [deg], you can write a vector diagram.
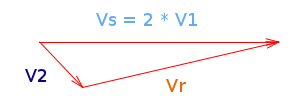
And from the diagram:
(%i1) Vs:1.0+%i*0.0;
(%i2) t:(-57.7/360.0)*2.0*%pi;    <- measured phase difference
(%i3) s:0.698/2.0;                <- measured voltage ratio times 1/2
(%i4) V2:s*(cos(t)+%i*sin(t));
(%i5) Vr:Vs-V2;                   <- voltage across R6
(%i6) z:50.0*(V2/Vr);             <- R6 is a 50 [phm] resistor
(%i7) float(realpart(z));
(%o7) 4.319309419115194
(%i8) float(imagpart(z));
(%o8) -19.69733542559636
(%i9) y:1/z;
(%i10) 1/realpart(y);
(%o10) 94.14602759832886          <- nominal 100 [ohm]
(%i11) 1/imagpart(y);
(%o12) 20.64445990101613
(%i28) float(1/(2.0*%pi*7026e3*(1/imagpart(y))));
(%o28) 1.0972572543782682*10^-9   <- nominal 1 [nF]