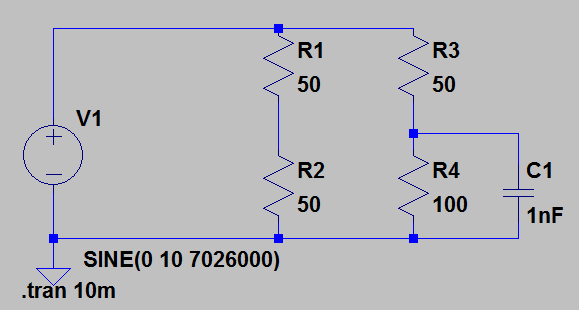
LTspice simulation results is shown with the same DUT (100 [ohm] // 1 [nF]).
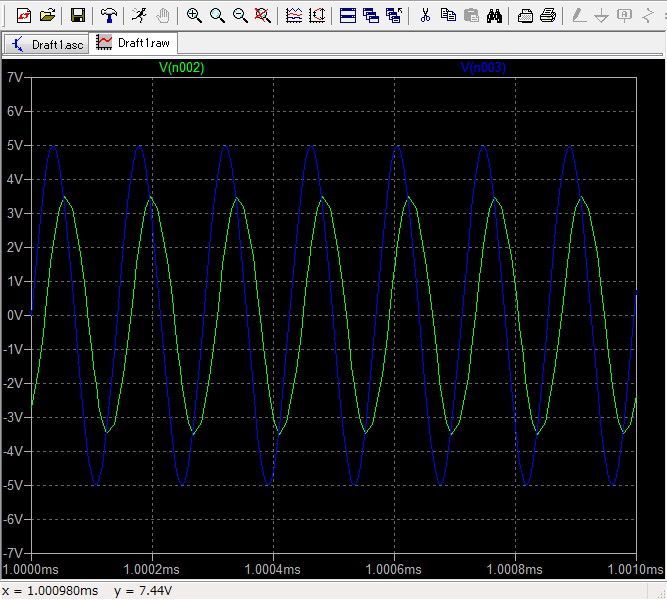
The voltage ratio is 3.50 [V] / 5.00 [V] = 0.70, and the phase difference is 21.48 [nS], both reasonably close to the actual measurement results.

Ham Radio Blog
LTspice simulation results is shown with the same DUT (100 [ohm] // 1 [nF]).
The voltage ratio is 3.50 [V] / 5.00 [V] = 0.70, and the phase difference is 21.48 [nS], both reasonably close to the actual measurement results.
Now, let’s try again with another DUT.

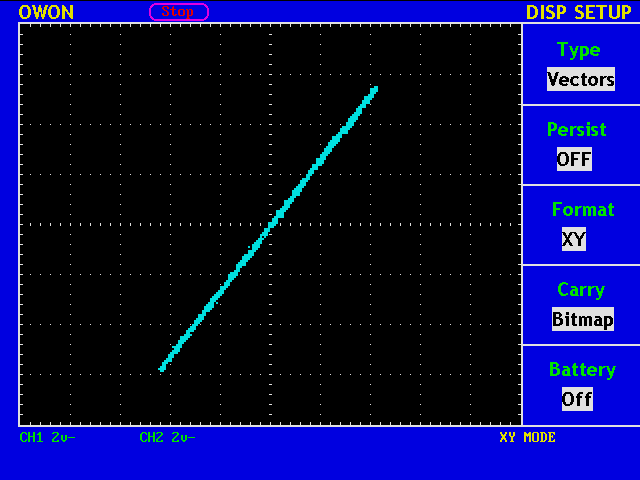
This time there is a phase difference, so we must determine complex impedance in the form Z = R + jX.

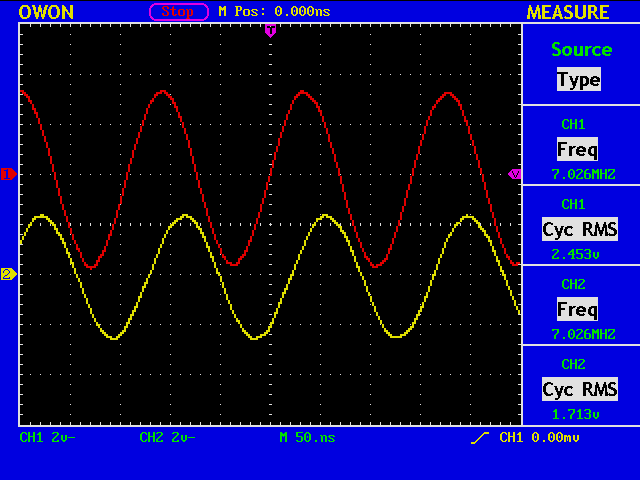
The voltage ratio is: V2/V1 = 1.713 [v] / 2.453 [v] = 0.698, and the phase difference is: 360.0 [deg] * (-22.80 [nS] / 142.32 [nS]) = -57.7 [deg], where 142.32 [nS] is the period for 7026kHz.
Assuming you know the answer that the DUT is 100 [ohm] // 1 [nF], the voltage ratio and the phase are obtained in the following manner. (This is a reverse way.)
(%i1) r6:50;
(%i2) r:100;                      <- here is your 100 [ohm]
(%i3) x:1/(%i*2*%pi*7026e3*1e-9); <- here is your 1 [nF]
(%i4) z:r*x/(r+x);
(%i5) v2:z/(z+r6);
(%i6) float(2*abs(v2));
(%o6) 0.74942127142784            <- voltage ratio
(%i7) float(carg(v2)*360/(2*%pi));
(%o7) -55.80120705365476          <- phase difference
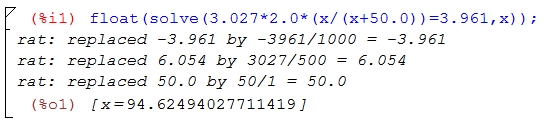
In most cases you do not the answer in advance, so you must go like this:
(%i1) t:(-57.7/360.0)*2.0*3.16; <- measured phase difference
(%i2) v:0.698/2.0;              <- measured voltage ratio
(%i3) r:50.0;
(%i4) float(solve([(R*(r+R)+X^2)/((r+R)^2+X^2)=v*cos(t),r*X/((r+R)^2+X^2)=v*sin(t)],[R,X]));
(%o4) [[R=-50.0,X=0.0],[R=4.183382859001799,X=-19.67880950916058]]
(%i5) Z:4.1833-19.6788*%i;
(%i6) Y:1/Z;
(%i7) 1/realpart(Y);
(%o7) 96.75499446131043         <- Real part of Z (nominal 100 [ohm])
(%i8) 1/imagpart(Y);
(%o8) 20.56808181037462         <- Imaginary part of Z
(%i9) C:1/(2.0*3.1416*7026e3*1/imagpart(Y)); <- convert to capacitance
(%o9) 1.1013292647891441*10^-9  <- 1.1 [nF] (nomnal 1 [nF])
To verify the above result, we go again the reverse way:
(%i1) r6:50;
(%i2) r:96.755;                        <- R=96.755 [ohm]
(%i3) x:1/(%i*2*%pi*7026e3*1.1013e-9); <- C=1.1013 [nF]
(%i4) z:r*x/(r+x);
(%i5) v2:z/(z+r6);
(%i6) float(2*abs(v2));
(%o6) 0.69801459091613                <- voltage ratio
(%i7) float(carg(v2)*360/(2*%pi));
(%o7) -58.03754068937465              <- phase difference
Not bad?
With a signal generator (SG), you can make a measurement of various parameters of your device. One example is impedance measurement.

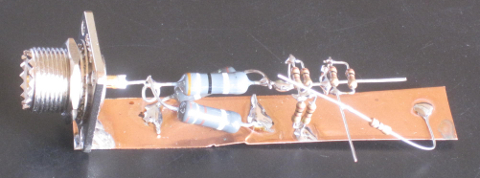
A fixed attenuator is inserted in front to improve the souce match. For 6dB attenuation, use R1=39 [ohm], R2=R3=150 [ohm]. “X” is the device under test (DUT), and R4=R5=R6=50 [ohm]. In the photograph, a 100 [ohm] resistor is employed as a DUT.

IC-7410 with tx frequency 7026kHz is used as a SG. RF power is minimized to 2 [W]. CH1 (in red) shows “V1”, and CH2 (in yellow) shows “V2”.
Since the DUT, a 100 [ohm] resistor, is pure resistive, there is no phase difference between the two waveforms.
By solving a simple equation, we conclude that the impedance of our DUT is 94.6 + j*0 [ohm].