
ggplot2を使うことは、Rでグラフを描くための別の方法です。
% head mydataR.txt
Frequency, R, X, Z, Return_Loss, VSWR, rhoAng, rhoAbs
2, 2.99567, -6.27359, 6.95212, 1.0258, 16.9545, -2.89108, 0.888607
2.01, 3.07187, -5.98362, 6.72608, 1.05344, 16.5107, -2.9025, 0.885784
2.02, 3.00247, -5.64513, 6.39393, 1.0312, 16.866, -2.91594, 0.888055
...
% R
> data<-read.table("mydataR.txt",sep=",",header=T)
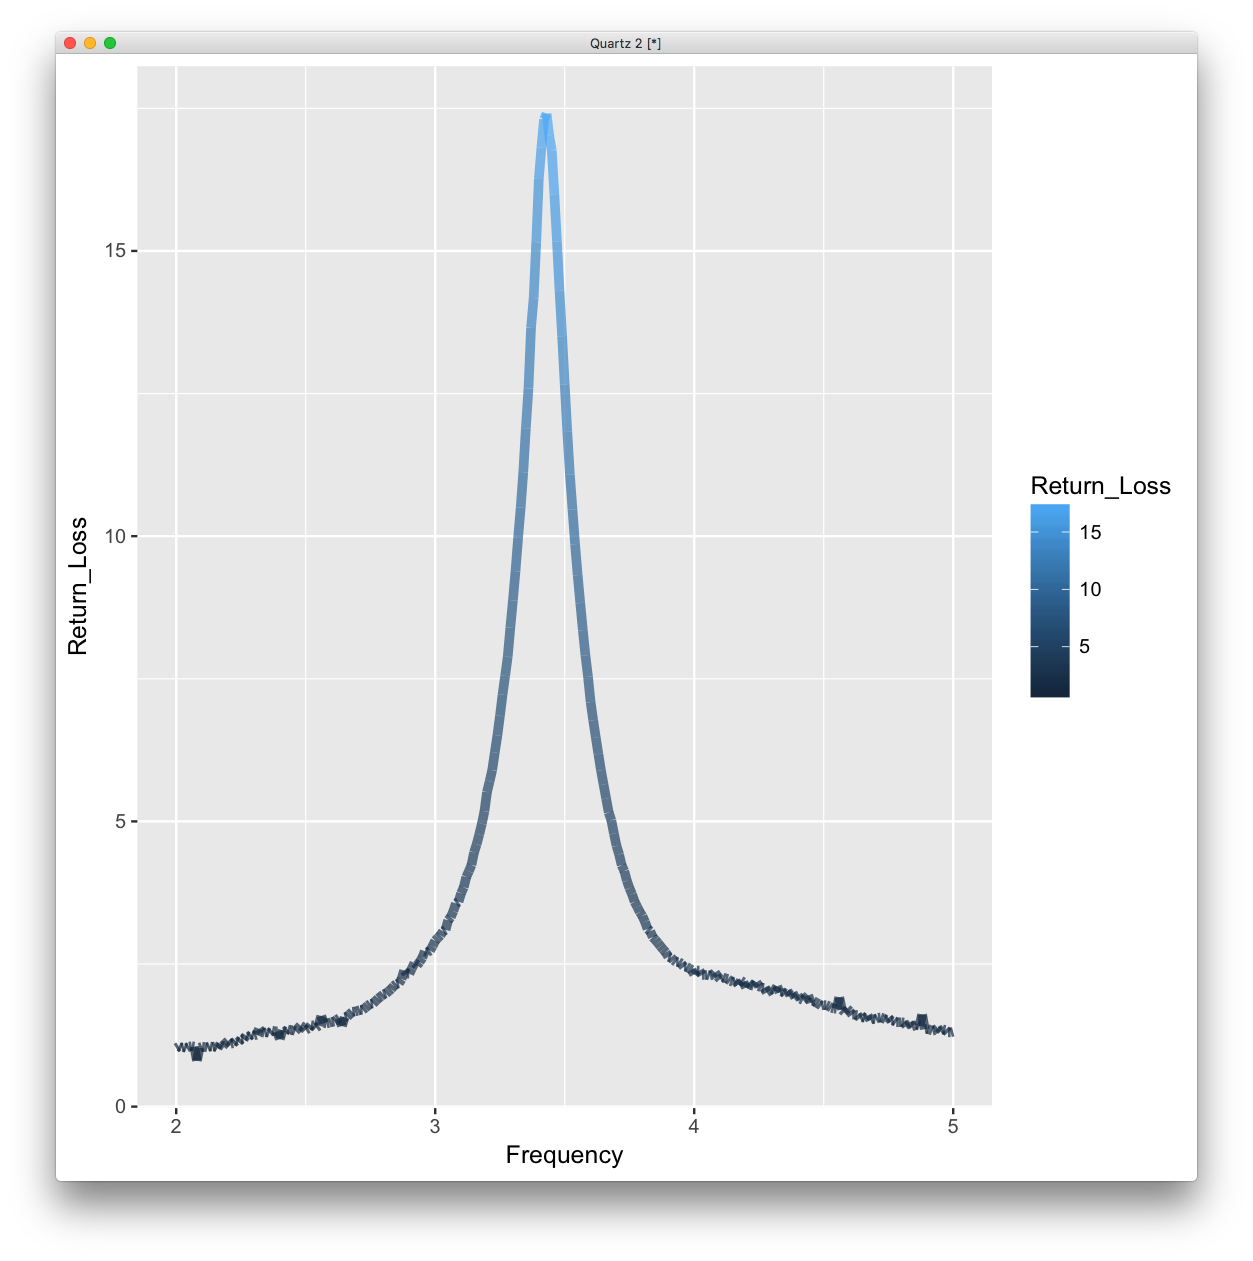
> gp = ggplot(data, aes(x=Frequency, y=Return_Loss, colour=Return_Loss))
> gp = gp + geom_line(size=2, alpha=0.7)
> print(gp)