
Gnuplotを用いれば、簡単に素敵なグラフを描くことができます。
あなたのAA-30.ZEROからの生データはこんな感じです:
...
2.990000,15.066906,46.652055
3.000000,15.557470,48.099209
3.010000,16.004803,48.884680
...
そして、スクリプトは:
# Gnuplot script for AA-30.ZERO
reset
set terminal aqua enhanced title "AA-30.ZERO" size 1200 900
set datafile separator ","
set grid
unset key
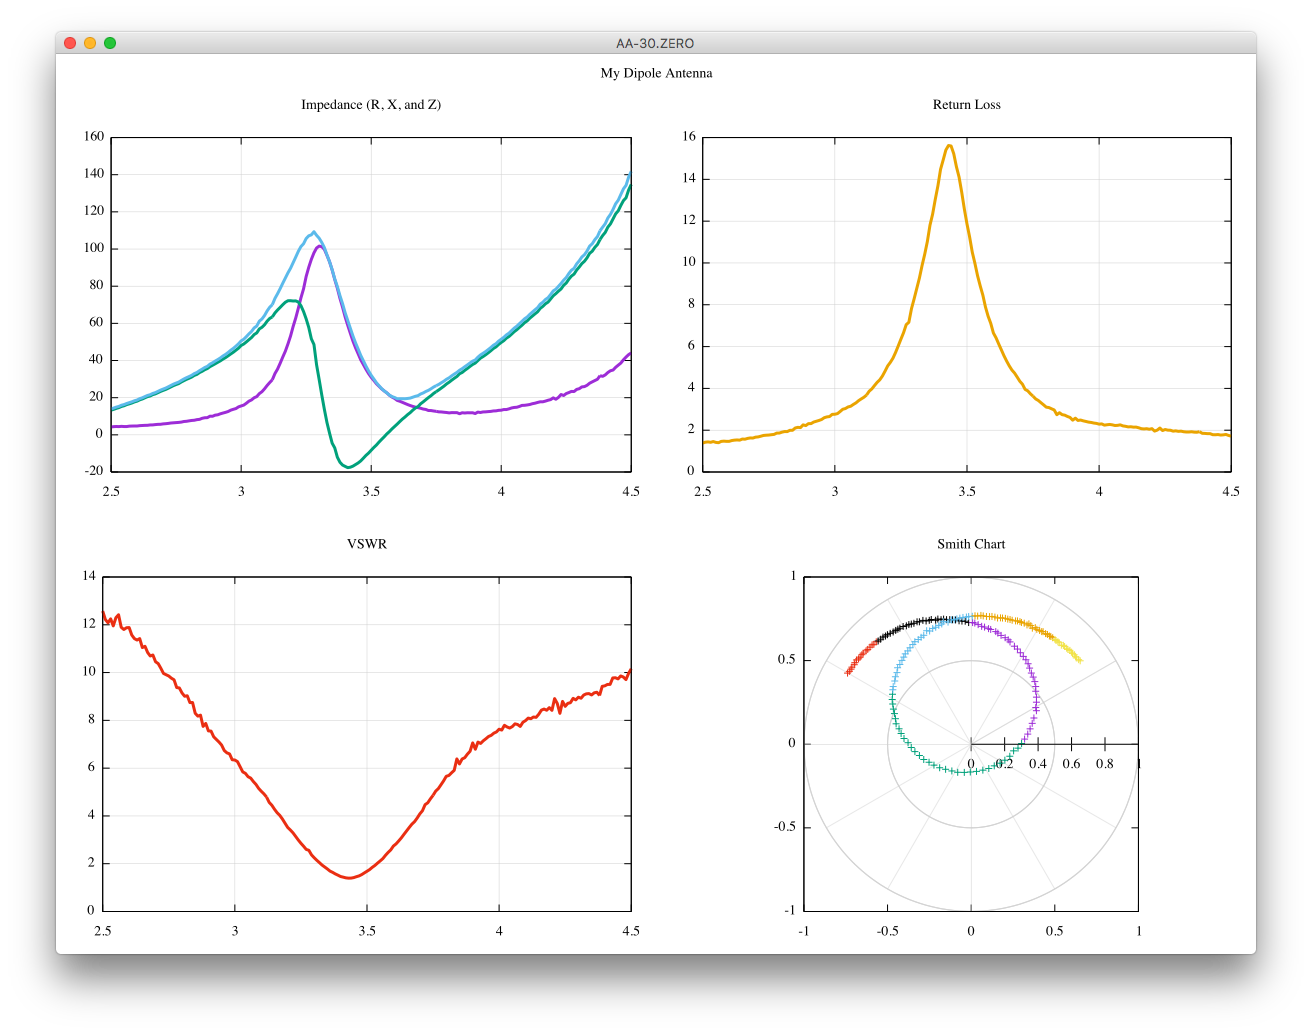
set multiplot layout 2,2 title "My Dipole Antenna"
set title "Impedance (R, X, and Z)"
plot "mydata.txt" using 1:2 with line linewidth 3, \
"mydata.txt" using 1:3 with line linewidth 3, \
"mydata.txt" using 1:( abs($2+$3*{0,1}) ) with line linewidth 3
set title "Return Loss"
plot "mydata.txt" using 1:( -20.0 * log(abs( ($2+$3*{0,1}-50)/($2+$3*{0,1}+50) )) / log(10) ) with line linewidth 3 linetype 4
set title "VSWR"
plot "mydata.txt" using 1:( (1+abs( ($2+$3*{0,1}-50)/($2+$3*{0,1}+50) )) / (1-abs( ($2+$3*{0,1}-50)/($2+$3*{0,1}+50) )) ) with line linewidth 3 linetype 7
set title "Smith Chart"
set polar
set grid polar
set size square
set xrange [-1:+1]
plot "mydata.txt" using (arg( ($2+$3*{0,1}-50)/($2+$3*{0,1}+50) )) : (abs( ($2+$3*{0,1}-50)/($2+$3*{0,1}+50) )) : (3*$1) with point pointtype 7 lc variable
unset multiplot
ターミナルタイプはあなたのプラットフォームに応じて設定して下さい。スクリプトの3行目を見て下さい。
そして、あなたがすることはこれだけです。
% ./aa30zero fq3500000 sw2000000 frx200 > mydata.txt
% gnuplot aa30zero.plt