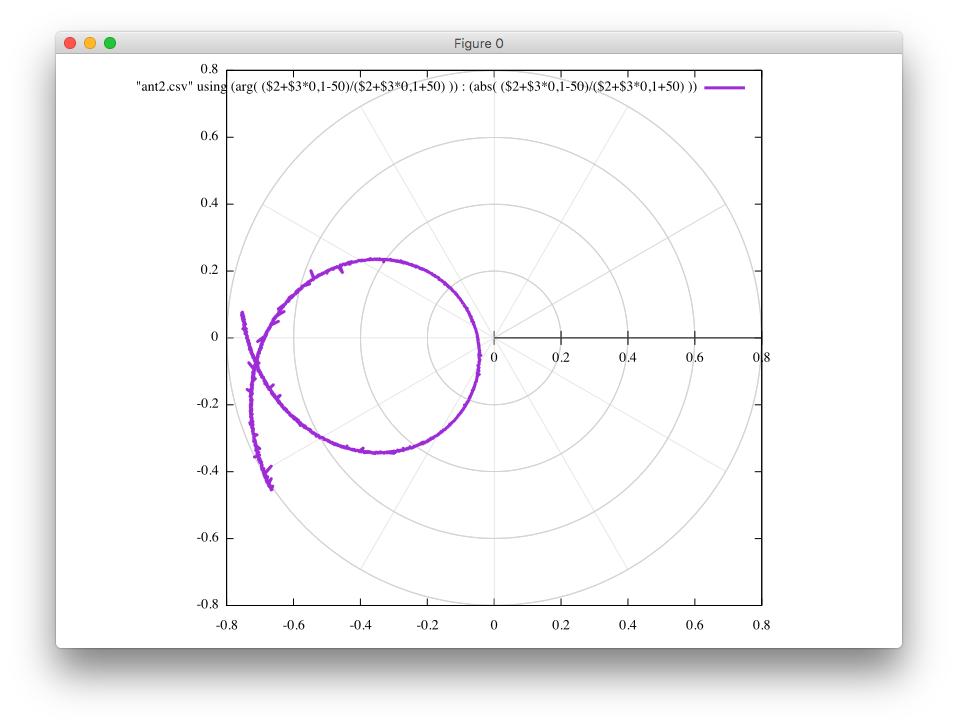
以下のgnuplotコマンドで、スミスチャートも描けます。
gnuplot> plot "ant2.csv" using (arg( ($2+$3*{0,1}-50)/($2+$3*{0,1}+50) )) : (abs( ($2+$3*{0,1}-50)/($2+$3*{0,1}+50) )) with line linewidth 3

Ham Radio Blog
以下のgnuplotコマンドで、スミスチャートも描けます。
gnuplot> plot "ant2.csv" using (arg( ($2+$3*{0,1}-50)/($2+$3*{0,1}+50) )) : (abs( ($2+$3*{0,1}-50)/($2+$3*{0,1}+50) )) with line linewidth 3