RigExpert AA-30 Zero用のPythonプログラム(3)

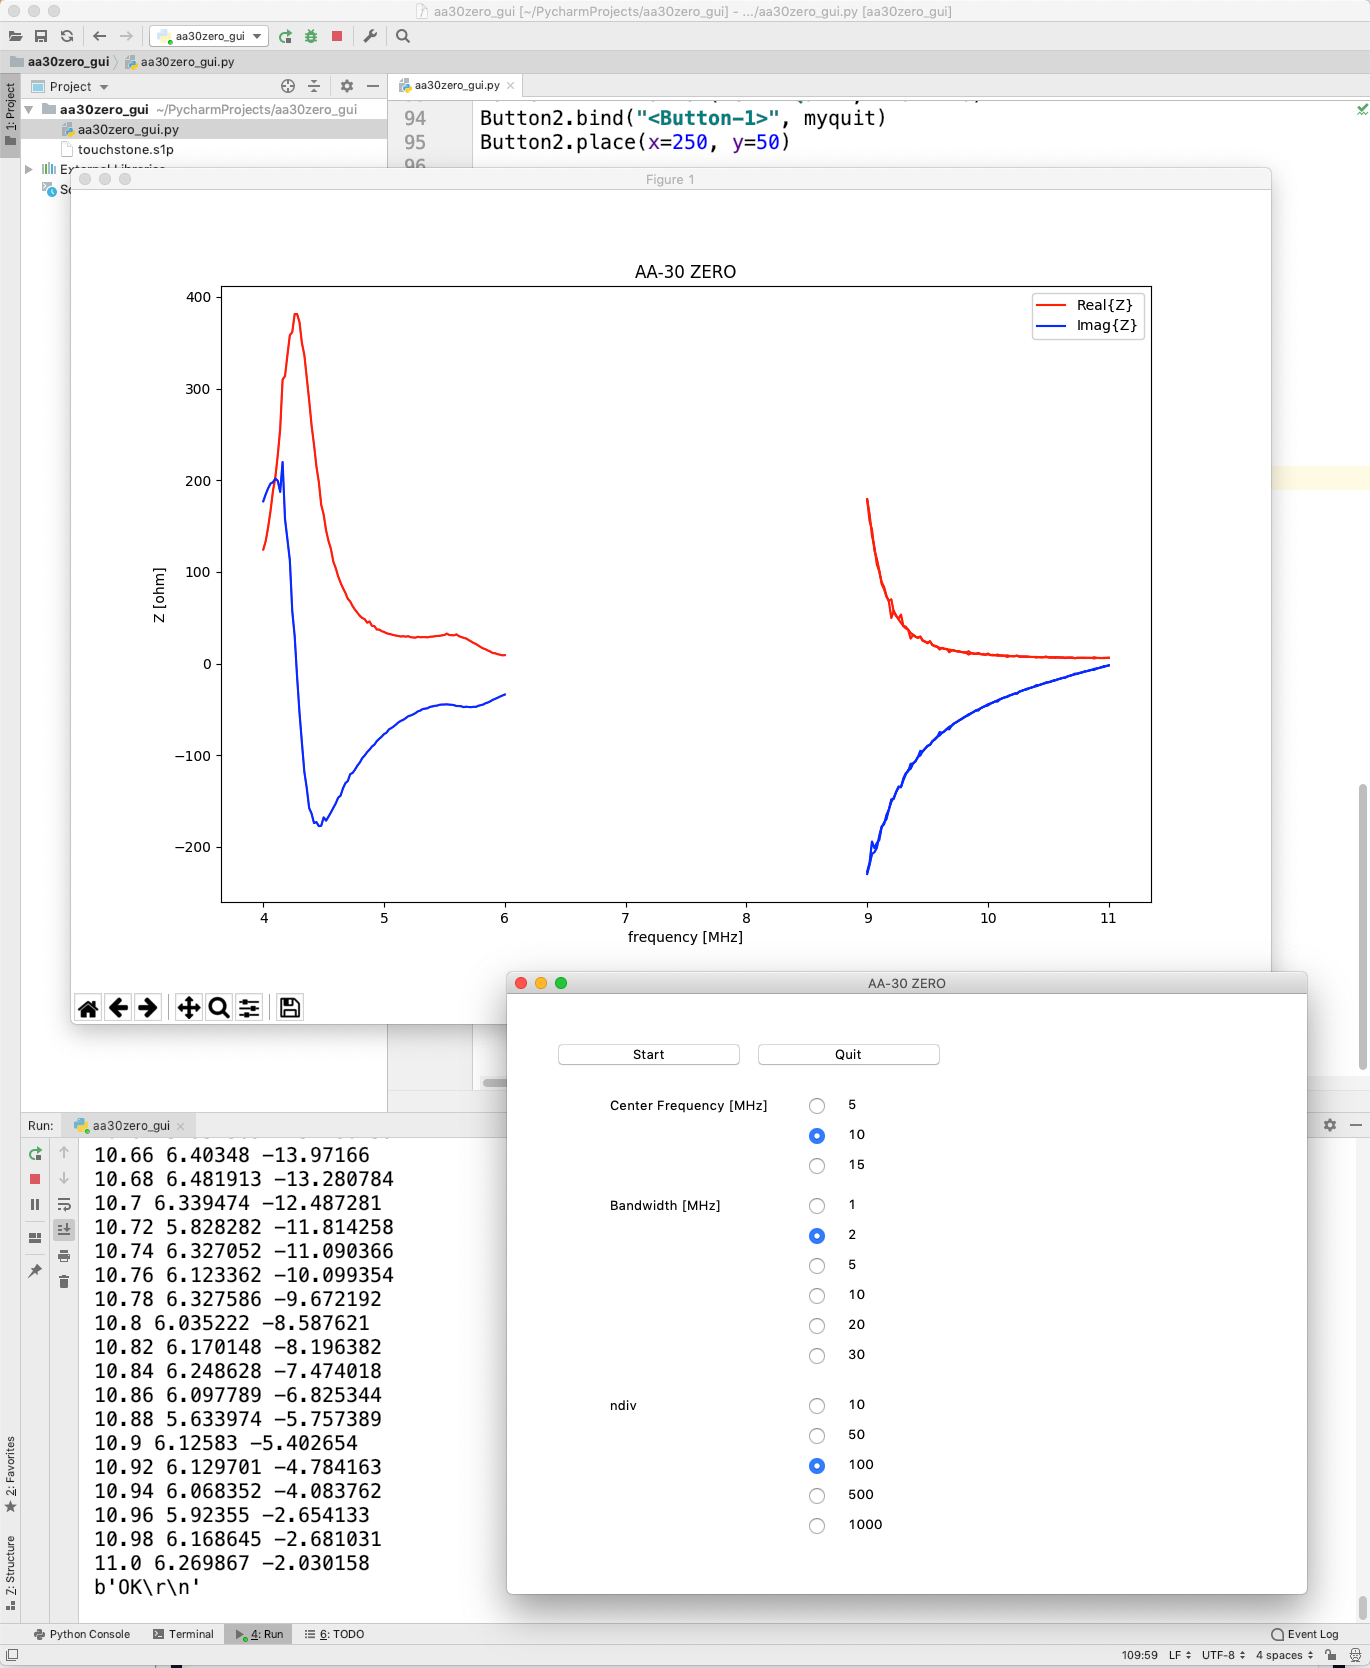
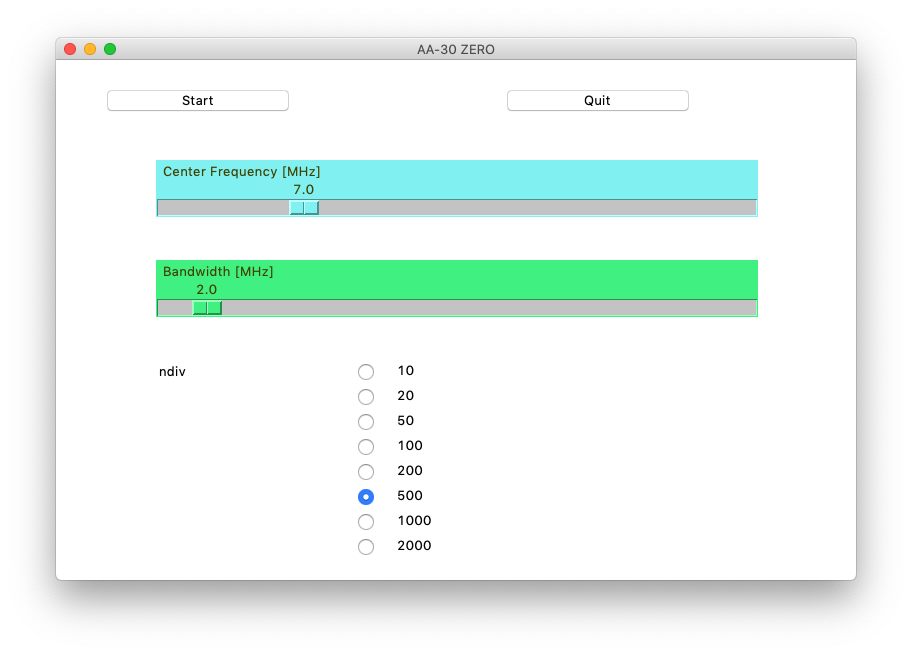
中心周波数と帯域幅は、スライダーで設定します。

# aa30zero_gui.py

import serial
import time
import sys
import math
import tkinter as tk
import matplotlib.pyplot as plt


def mystart(event):
    print("clicked at", event.x, event.y, ", v = ", v2.get())
    print(Slider0.get(), Slider1.get())
    measure(Slider0.get(), Slider1.get(), v2.get())


def myquit(event):
    print("quit at", event.x, event.y)
    sys.exit(0)


def measure(i0, i1, i2):
    f = open('touchstone.s1p', 'w')
    ser = serial.Serial('/dev/cu.usbmodem14701', 38400, timeout=1)
    print(ser.name)

    time.sleep(2)
    command_0 = b'ver' + b'\x0a'
    print(command_0)
    ser.write(command_0)

    time.sleep(1)
    command_1 = b'fq' + str(int(10.0 * i0)).encode('ASCII') + b'00000' + b'\x0a'
    print(command_1)
    ser.write(command_1)

    time.sleep(1)
    command_2 = b'sw' + str(int(10.0 * i1)).encode('ASCII') + b'00000' + b'\x0a'
    print(command_2)
    ser.write(command_2)

    for i in range(3):
        line = ser.readline()
        print(line)

    time.sleep(1)
    ser.write(b'frx' + str(ndiv_list[i2]).encode('ASCII') + b'\x0a')

    f.write('# MHz S RI R 50 \n')

    z0 = complex(50.0, 0.0)
    freq_list = []
    zr_list = []
    zi_list = []
    retloss_list = []
    vswr_list = []

    for i in range(int(ndiv_list[i2]) + 1):
        line = ser.readline().decode(encoding='utf-8').rstrip().split(',')
        freq = float(line[0])
        if freq < 0.5:
            continue
        z = complex(float(line[1]), float(line[2]))
        rho = (z - z0) / (z + z0)
        retloss = -20.0 * math.log10(abs(rho))
        vswr = (1 + abs(rho)) / (1 - abs(rho))
        freq_list.append(freq)
        zr_list.append(z.real)
        zi_list.append(z.imag)
        retloss_list.append(retloss)
        vswr_list.append(vswr)
        print(freq, z.real, z.imag, rho, retloss, vswr)
        f.write('{0} {1} {2} \n'.format(freq, rho.real, rho.imag))

    for i in range(1):
        line = ser.readline()
        print(line)

    ser.close()

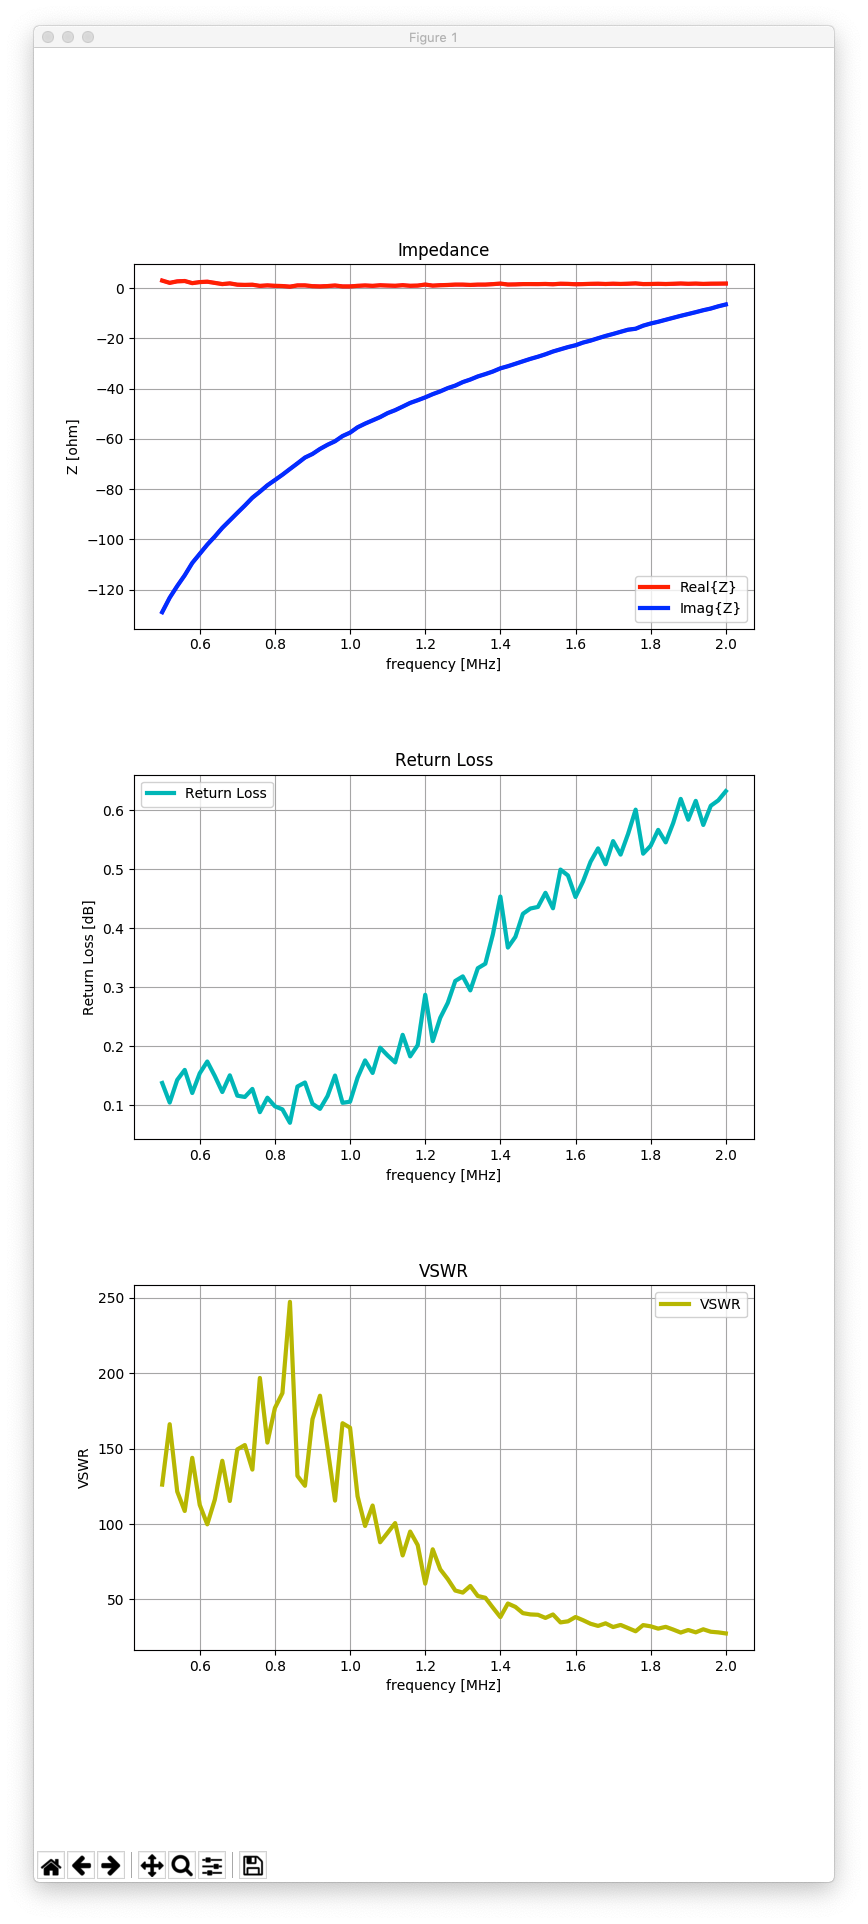
    fig = plt.figure(1, figsize=(8, 18))
    ax0 = fig.add_subplot(311)
    ax0.plot(freq_list, zr_list, 'r-', label='Real{Z}', linewidth=3)
    ax0.plot(freq_list, zi_list, 'b-', label='Imag{Z}', linewidth=3)

    ax1 = fig.add_subplot(312)
    ax1.plot(freq_list, retloss_list, 'c-', label='Return Loss', linewidth=3)

    ax2 = fig.add_subplot(313)
    ax2.plot(freq_list, vswr_list, 'y-', label='VSWR', linewidth=3)

    global plt_count
    if plt_count == 0:
        ax0.set_xlabel('frequency [MHz]')
        ax0.set_ylabel('Z [ohm]')
        ax0.set_title("Impedance")
        ax0.grid()
        ax0.legend()

        ax1.set_xlabel('frequency [MHz]')
        ax1.set_ylabel('Return Loss [dB]')
        ax1.set_title("Return Loss")
        ax1.grid()
        ax1.legend()

        ax2.set_xlabel('frequency [MHz]')
        ax2.set_ylabel('VSWR')
        ax2.set_title("VSWR")
        ax2.grid()
        ax2.legend()

        plt.subplots_adjust(hspace=0.4)
    plt_count += 1
    plt.show()


plt_count = 0

ndiv_list = [10, 20, 50, 100, 200, 500, 1000, 2000]

root = tk.Tk()
root.title('AA-30 ZERO')
root.geometry('800x520')

Button = tk.Button(text='Start', width=20)
Button.bind("<Button-1>", mystart)
Button.place(x=50, y=30)

Button2 = tk.Button(text='Quit', width=20)
Button2.bind("<Button-1>", myquit)
Button2.place(x=450, y=30)

Slider0 = tk.Scale(root, from_=0.1, to=30.0,
                   orient=tk.HORIZONTAL, resolution=0.1,
                   digits=3, length=600, fg='#404000', bg='#80f0f0',
                   label='Center Frequency [MHz]')
Slider1 = tk.Scale(root, from_=0.1, to=30.0,
                   orient=tk.HORIZONTAL, resolution=0.2,
                   digits=3, length=600, fg='#404000', bg='#40f080',
                   label='Bandwidth [MHz]')

Slider0.place(x=100, y=100)
Slider1.place(x=100, y=200)

Slider0.set(7.0)
Slider1.set(2.0)

v2 = tk.IntVar()
v2.set(0)
tk.Label(root, text='ndiv').place(x=100, y=300)
for index, value in enumerate(ndiv_list):
    tk.Radiobutton(root,
                   text=value,
                   padx=20,
                   variable=v2,
                   value=index).place(x=300, y=300 + 25 * index)

root.mainloop()
sys.exit(0)

RigExpert AA-30 Zero用のPythonプログラム(2)

これは、GUIバージョンのプログラムです。

Tkinterと言うライブラリで、GUIの部分を処理しています。

あなたはパラメーターを変えて測定を繰り返し、同じグラフの上に結果を重ねてプロットすることができます。

# aa30zero_gui.py

import serial
import time
import sys
import tkinter as tk
import matplotlib.pyplot as plt


def mystart(event):
    print("clicked at", event.x, event.y, ", v = ", v0.get(), v1.get(), v2.get())
    measure(v0.get(), v1.get(), v2.get())


def myquit(event):
    print("quit at", event.x, event.y)
    sys.exit(0)


def measure(i0, i1, i2):
    f = open('touchstone.s1p', 'w')
    ser = serial.Serial('/dev/cu.usbmodem14701', 38400, timeout=1)
    print(ser.name)

    time.sleep(2)
    ser.write(b'ver' + b'\x0a')

    time.sleep(1)
    ser.write(b'fq' + str(freq_list[i0]).encode('ASCII') + b'000000' + b'\x0a')

    time.sleep(1)
    ser.write(b'sw' + str(bw_list[i1]).encode('ASCII') + b'000000' + b'\x0a')

    for i in range(3):
        line = ser.readline()
        print(line)

    time.sleep(1)
    ser.write(b'frx' + str(ndiv_list[i2]).encode('ASCII') + b'\x0a')

    f.write('# MHz S RI R 50 \n')

    z0 = complex(50.0, 0.0)
    ff_list = []
    zr_list = []
    zi_list = []

    for i in range(int(ndiv_list[i2]) + 1):
        line = ser.readline().decode(encoding='utf-8').rstrip().split(',')
        freq = float(line[0])
        z = complex(float(line[1]), float(line[2]))
        rho = (z - z0) / (z + z0)
        ff_list.append(freq)
        zr_list.append(z.real)
        zi_list.append(z.imag)
        print(freq, z.real, z.imag)
        f.write('{0} {1} {2} \n'.format(freq, rho.real, rho.imag))

    for i in range(1):
        line = ser.readline()
        print(line)

    ser.close()

    plt.figure(1, figsize=(12, 8))
    plt.plot(ff_list, zr_list, 'r-', label='Real{Z}')
    plt.plot(ff_list, zi_list, 'b-', label='Imag{Z}')

    global plt_count
    if plt_count == 0:
        plt.legend()
        plt.xlabel('frequency [MHz]')
        plt.ylabel('Z [ohm]')
        plt.title("AA-30 ZERO")
    plt_count += 1
    plt.show()


plt_count = 0

freq_list = [5, 10, 15]
bw_list = [1, 2, 5, 10, 20, 30]
ndiv_list = [10, 50, 100, 500, 1000]

root = tk.Tk()
root.title('AA-30 ZERO')
root.geometry('800x600')

Button = tk.Button(text='Start', width=20)
Button.bind("<Button-1>", mystart)
Button.place(x=50, y=50)

Button2 = tk.Button(text='Quit', width=20)
Button2.bind("<Button-1>", myquit)
Button2.place(x=250, y=50)

v0 = tk.IntVar()
v0.set(0)
tk.Label(root, text='Center Frequency [MHz]').place(x=100, y=100)
for index, value in enumerate(freq_list):
    tk.Radiobutton(root,
                   text=value,
                   padx=20,
                   variable=v0,
                   value=index).place(x=300, y=100 + 30 * index)

v1 = tk.IntVar()
v1.set(0)
tk.Label(root, text='Bandwidth [MHz]').place(x=100, y=200)
for index, value in enumerate(bw_list):
    tk.Radiobutton(root,
                   text=value,
                   padx=20,
                   variable=v1,
                   value=index).place(x=300, y=200 + 30 * index)
v2 = tk.IntVar()
v2.set(0)

tk.Label(root, text='ndiv').place(x=100, y=400)
for index, value in enumerate(ndiv_list):
    tk.Radiobutton(root,
                   text=value,
                   padx=20,
                   variable=v2,
                   value=index).place(x=300, y=400 + 30 * index)

root.mainloop()
sys.exit(0)

RigExpert AA-30 Zero用のPythonプログラム

AA-30 Zeroは、RigExpert社のローコストなアンテナ・アナライザーです。

私の以前のプログラム は、C, C++, AWK, gnuplotの混ぜこぜだったのですが、これはPythonで書かれたバージョンです。

# aa30zero.py

import serial
import time
import argparse

parser = argparse.ArgumentParser()
parser.add_argument("freq", help="center freq in kHz, example 7000000")
parser.add_argument("bw", help="band width in kHz, example 2000000")
parser.add_argument("ndiv", help="no. of divisions, example 100")

args = parser.parse_args()
print('!! freq = ', args.freq)
print('!! bw = ', args.bw)
print('!! ndiv = ', args.ndiv)

ser = serial.Serial('/dev/cu.usbmodem14701', 38400, timeout=1)
print('!! ', ser)

time.sleep(2)
ser.write(b'ver'+b'\x0a')

time.sleep(1)
ser.write(b'fq'+args.freq.encode('ASCII')+b'\x0a')

time.sleep(1)
ser.write(b'sw'+args.bw.encode('ASCII')+b'\x0a')

for i in range(3):
    line = ser.readline()
    print('!! ', line)

time.sleep(1)
ser.write(b'frx'+args.ndiv.encode('ASCII')+b'\x0a')

print('# MHz S RI R 50')
z0 = complex(50.0, 0.0)

for i in range(int(args.ndiv)+1):
    line = ser.readline().decode(encoding='utf-8').rstrip().split(',')
    freq = float(line[0])
    z = complex(float(line[1]), float(line[2]))
    rho = (z-z0)/(z+z0)
    print('! ', freq, z.real, z.imag)
    print(freq, rho.real, rho.imag)

for i in range(1):
    line = ser.readline()
    print('!! ', line)

ser.close()

最初のプログラムは、AA-30 Zeroを制御して、touchstoneファイルを生成します。

PythonのライブラリpySerialを用いて、デバイスと通信を行います。

$ python aa30zero.py 5200000 1000000 100 | tee touchstone.s1p
 
$ cat touchstone.s1p
!! freq =  5200000
!! bw =  1000000
!! ndiv =  100
!!  Serial<id=0x10fab2860, open=True>(port='/dev/cu.usbmodem14701', baudrate=38400, bytesize=8, parity='N', stopbits=1, timeout=1, xonxoff=False, rtscts=False, dsrdtr=False)
!!  b'AA-30 ZERO 150\r\n'
!!  b'OK\r\n'
!!  b'OK\r\n'
# MHz S RI R 50
!  4.7 26.910389 -45.76308
4.7 0.0397565169109296 -0.5713623335864779
...

$ python scikit-rf.py

二番目のプログラムは、touchstoneファイルを読み出してスクリーン上にグラフを幾つか表示します。

# scikit-rf.py

import matplotlib.pyplot as plt
import skrf as rf
from pylab import xkcd
import numpy as np

xkcd()
plt.style.use('ggplot')
plt.figure(figsize=(8, 18))

nwk = rf.Network('touchstone.s1p')

index = np.argmin(nwk.s_db)
fpeak = nwk.f[index] / 1000000 # fvector in Hz
rlmax = nwk.s_db[index, 0, 0]

plt.subplot(4, 1, 1)
nwk.plot_s_db(label='S11 [dB]', lw=3)
plt.title('Return Loss max = {0:.2f} dB at {1} [MHz]'.format(-rlmax, fpeak))
plt.grid(True)

plt.subplot(4, 1, 2)
nwk.plot_z_re(label='Real{Z}', color='blue', lw=3)
plt.grid(True)

plt.subplot(4, 1, 3)
nwk.plot_z_im(label='Imag{Z}', color='orange', lw=3)
plt.grid(True)

plt.subplot(4, 1, 4)
nwk.plot_s_smith(label='S11', draw_labels=True, color='green', lw=3)

plt.show()

scikit-rfというライブラリのおかげで、このプログラムは非常にシンプルです。