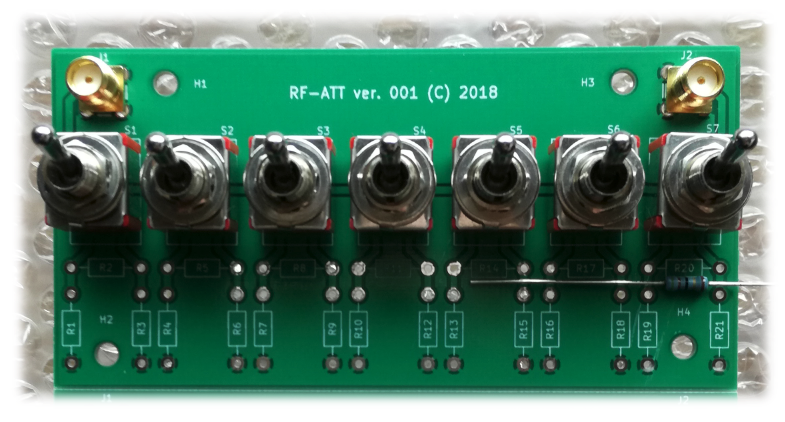
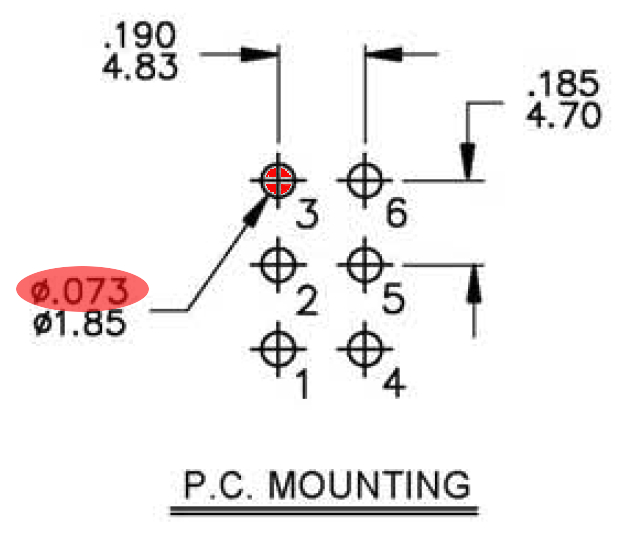
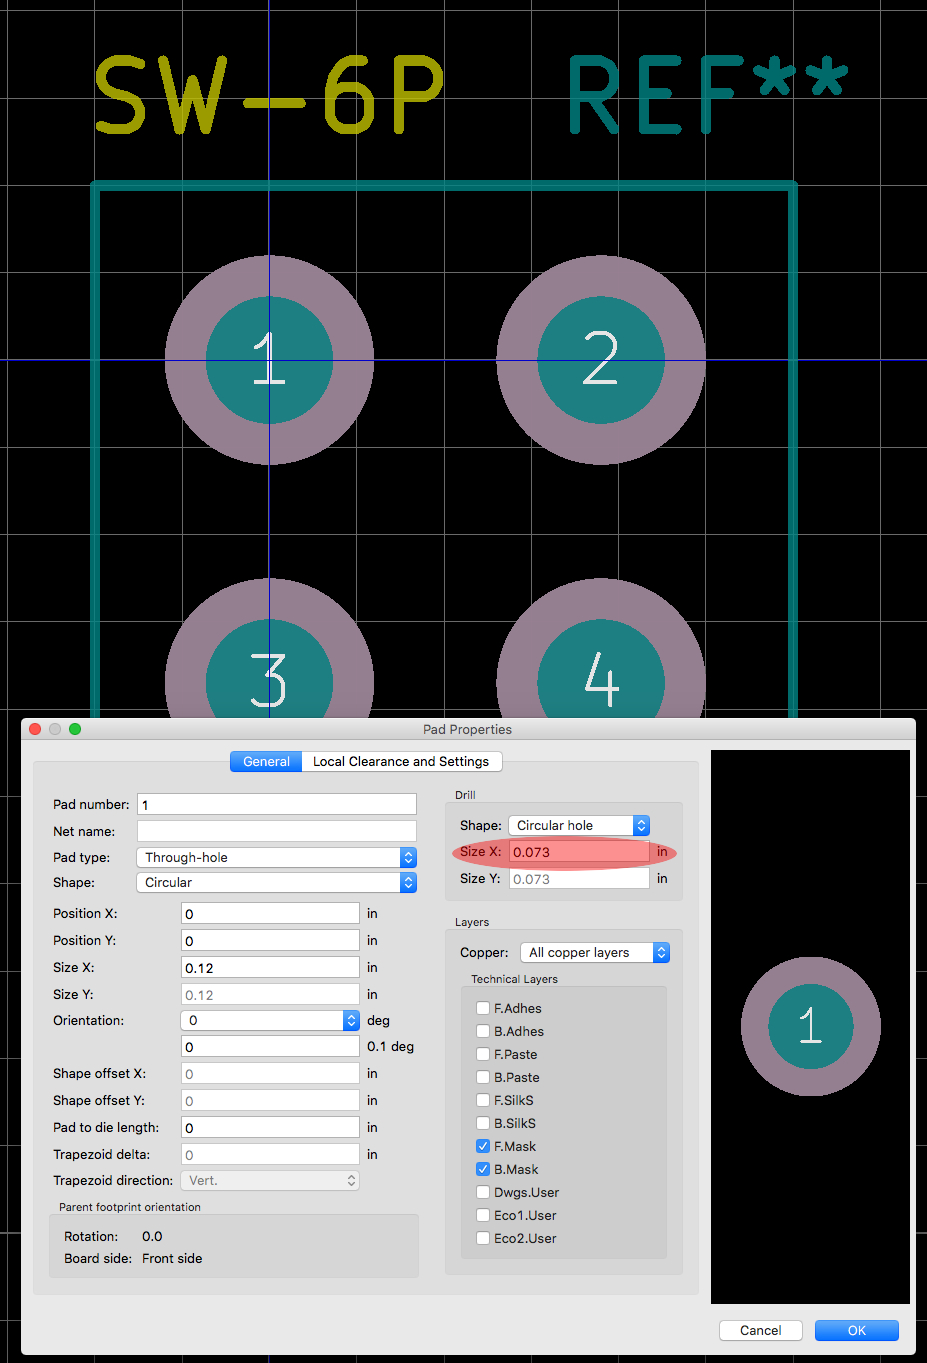
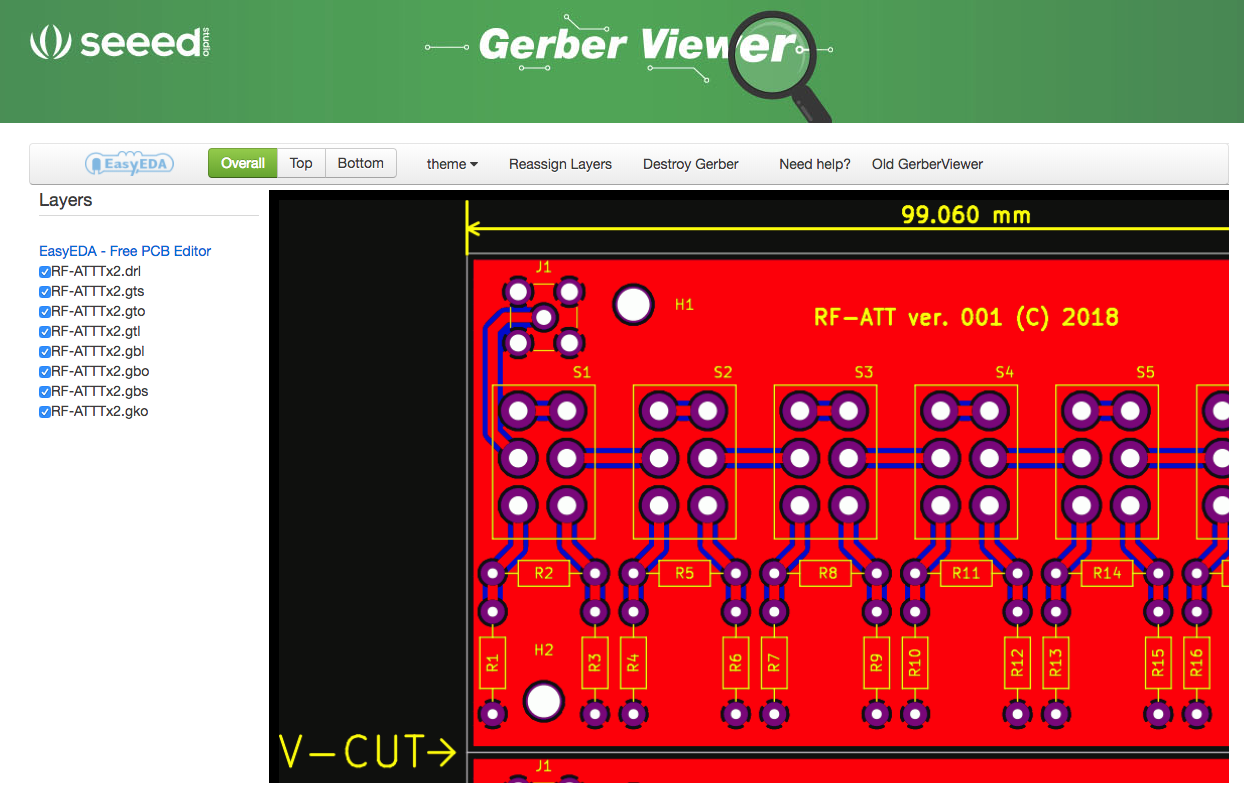
明白な間違いというのは無いようです。
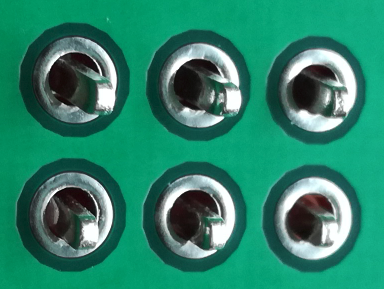
穴が、大きすぎますか?

Ham Radio Blog
明白な間違いというのは無いようです。
穴が、大きすぎますか?
import pyaudio
import numpy as np
import matplotlib.pyplot as plt
import time
import sys
import matplotlib.animation as animation
from scipy.signal import hilbert
from scipy.signal import medfilt
from sklearn.cluster import KMeans
CHUNK = 16384
FORMAT = pyaudio.paInt16
CHANNELS = 1
RATE = 8000
NMEDIAN = 51
NHIST = 100
duration_max = 1000
write_count = 0
read_count = 0
count = 0
trig_count = 0
t_up = 0
t_down = 0
y3_b4 = 0
up = []
down = []
x = np.arange(CHUNK)
y = np.zeros(CHUNK)
y1 = np.zeros(CHUNK)
y2 = np.zeros(CHUNK)
y3 = np.zeros(CHUNK)
#xx = np.arange(CHUNK*2)
yy = np.zeros(CHUNK*2)
y_buf = np.zeros(CHUNK*2)
p = pyaudio.PyAudio()
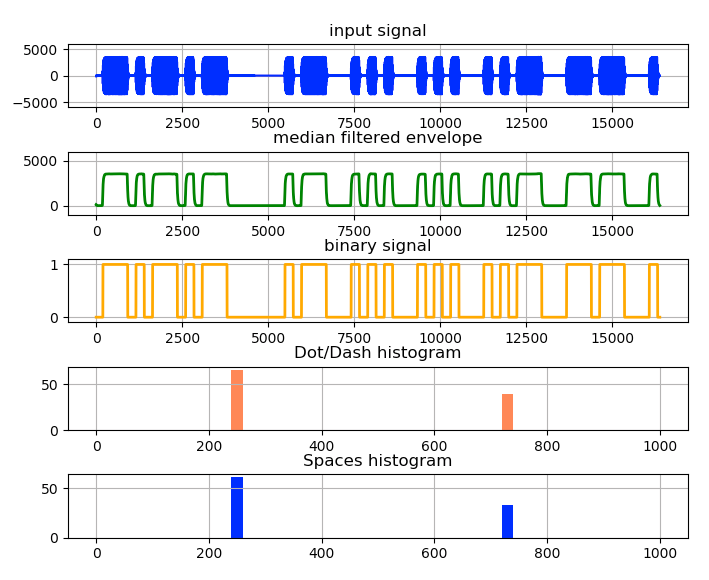
fig = plt.figure(1, figsize=(8, 12))
fig.subplots_adjust(hspace=0.7, wspace=0.1)
ax1 = fig.add_subplot(9,1,1)
plt.title('input signal')
ax2 = fig.add_subplot(9,1,2)
plt.title('median filtered envelope')
ax3 = fig.add_subplot(9,1,3)
plt.title('binary signal')
ax4 = fig.add_subplot(9,1,4)
plt.title('Dot/Dash histogram')
ax5 = fig.add_subplot(9,1,5)
plt.title('Spaces histogram')
for ax in fig.axes:
ax.grid(True)
ax1.set_ylim(-6000, 6000)
ax2.set_ylim(-1000, 6000)
ax3.set_ylim(-0.1, 1.1)
line1, = ax1.plot(x, y, color='blue')
line2, = ax2.plot(x, y, color='green', lw=2)
line3, = ax3.plot(x, y, color='orange', lw=2)
def callback(in_data, frame_count, time_info, status):
global y_buf
global write_count
z = np.frombuffer(in_data, dtype="int16")
for i in range(CHUNK):
y_buf[i ] = y_buf[i+CHUNK]
y_buf[i+CHUNK] = z [i]
write_count += 1
return (None, pyaudio.paContinue)
stream = p.open(format=FORMAT, channels=CHANNELS, rate=RATE,
input=True, frames_per_buffer=CHUNK,
stream_callback=callback)
stream.start_stream()
def animate_init():
line1.set_ydata(y)
line2.set_ydata(y)
line3.set_ydata(y)
return line1, line2, line3
def animate(i):
global read_count, y1, y2
global count, trig_count, t_up, t_down, y3_b4, up, down
while write_count > read_count:
line1.set_ydata(y_buf)
y4 = medfilt(np.abs(hilbert(y_buf)), NMEDIAN)
for i in range(CHUNK):
y1[i] = y_buf[i+CHUNK//2]
y2[i] = y4 [i+CHUNK//2]
th = 0.5 * y2.max()
for i in range(CHUNK):
if y2[i] > th:
y3[i] = 1
else:
y3[i] = 0
for i in range(CHUNK):
if y3_b4 == 0 and y3[i] == 1:
trig_count += 1
t_up = i+read_count*CHUNK
t_down_duration = t_up - t_down
if trig_count > 1: # not the first time
down.append(t_down_duration)
if len(down) == NHIST:
ax4.hist(up, density=False, alpha=1.0, range=(0,duration_max), bins=50, color="coral")
ax5.hist(down, density=False, alpha=1.0, range=(0,duration_max), bins=50, color="blue")
up = []
down = []
if y3_b4 == 1 and y3[i] == 0 and trig_count > 0:
t_down = i+read_count*CHUNK
t_up_duration = t_down - t_up
up.append(t_up_duration)
y3_b4 = y3[i]
line1.set_ydata(y1)
line2.set_ydata(y2)
line3.set_ydata(y3)
read_count += 1
return line1, line2, line3
ani = animation.FuncAnimation(fig, animate, interval=100, init_func=animate_init, blit=True)
plt.show()
print('\njob end')
stream.stop_stream()
stream.close()
p.terminate()
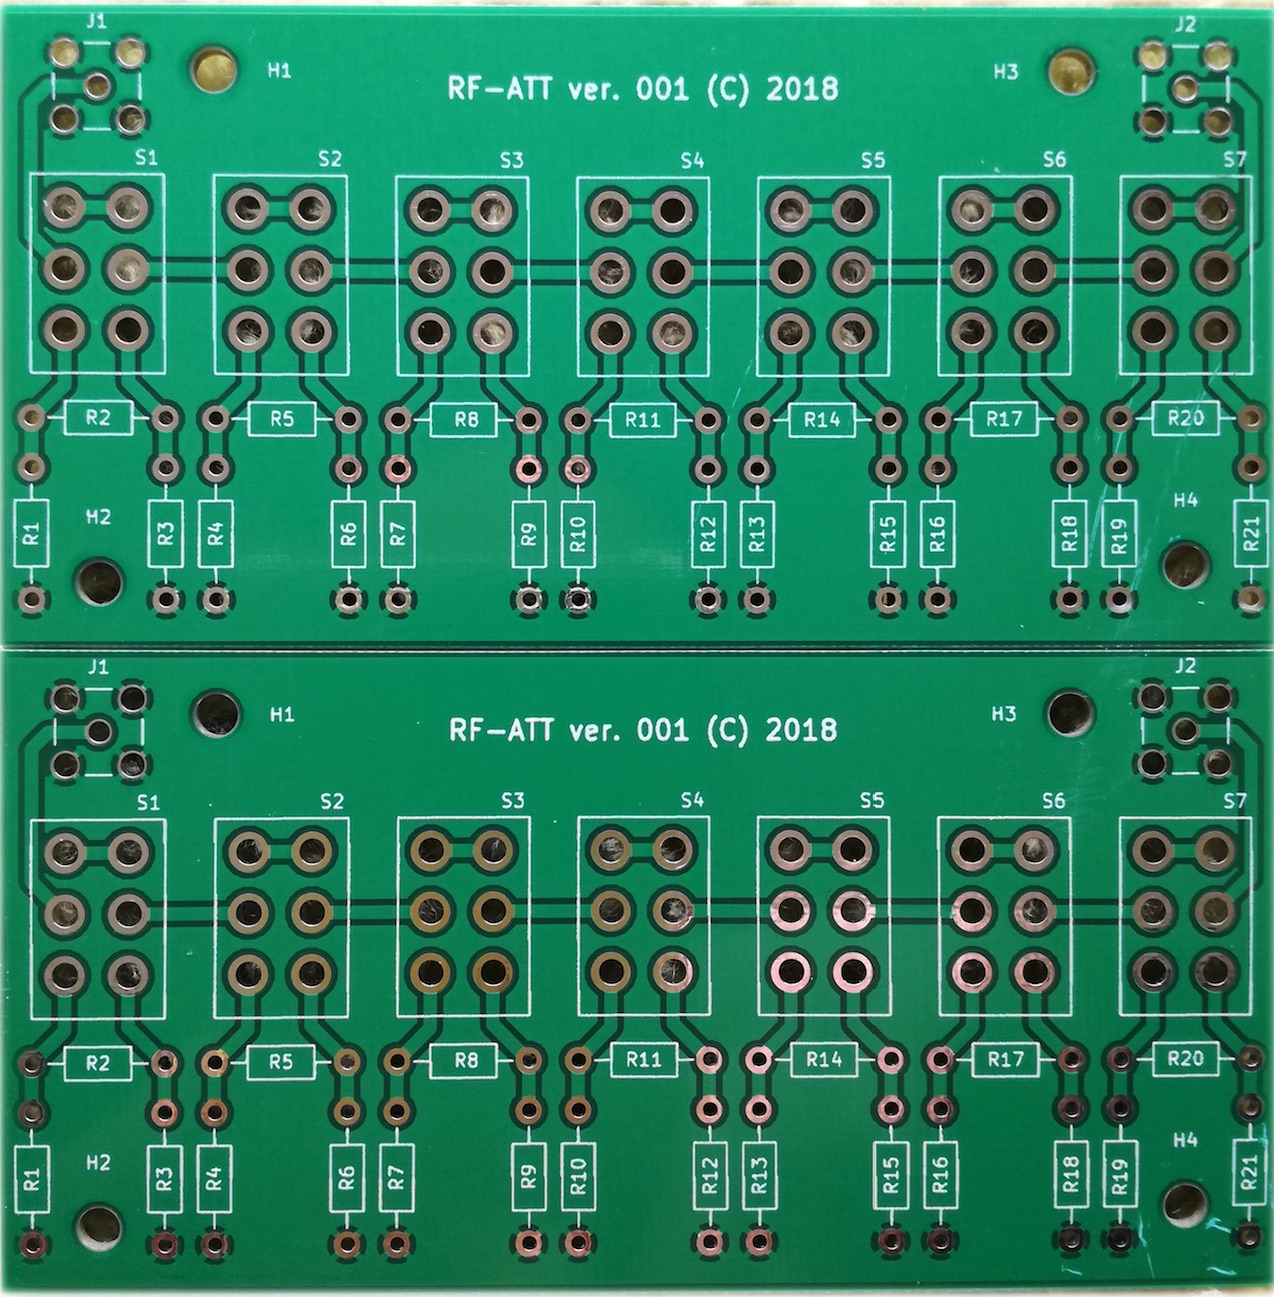
2月7日に注文して、3月15日に届きました。
import pyaudio
import numpy as np
import matplotlib.pyplot as plt
import time
import sys
from scipy.signal import hilbert
from scipy.signal import medfilt
from sklearn.cluster import KMeans
CHUNK = 8001
FORMAT = pyaudio.paInt16
CHANNELS = 1
RATE = 8000
x = range (CHUNK)
y = np.zeros(CHUNK)
binary = np.zeros(CHUNK)
xx = range (CHUNK*2)
yy = np.zeros(CHUNK*2)
fig1 = plt.figure(1, figsize=(8, 19))
fig1.subplots_adjust(hspace=0.8, wspace=0.1)
ax1 = fig1.add_subplot(9,1,1)
ax1.set_xlim(CHUNK/2,CHUNK+CHUNK/2)
lines1, = plt.plot(xx,yy, color="green")
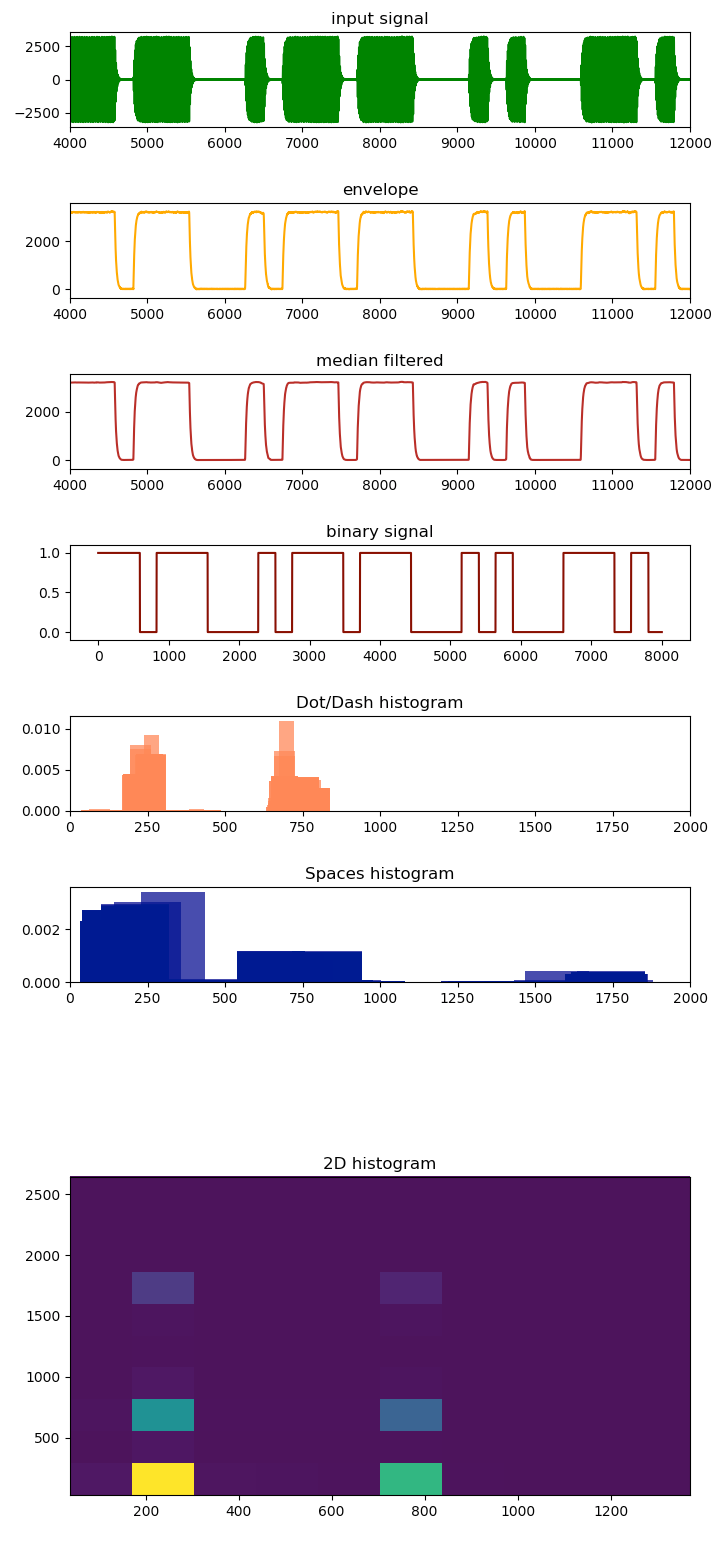
plt.title('input signal')
ax2 = fig1.add_subplot(9,1,2)
ax2.set_xlim(CHUNK/2,CHUNK+CHUNK/2)
lines2, = plt.plot(xx,yy, color="orange")
plt.title('envelope')
ax3 = fig1.add_subplot(9,1,3)
ax3.set_xlim(CHUNK/2,CHUNK+CHUNK/2)
lines3, = plt.plot(xx,yy, color="firebrick")
plt.title('median filtered')
ax4 = fig1.add_subplot(9,1,4)
lines4, = plt.plot(x,y, color="maroon")
plt.title('binary signal')
ax5 = fig1.add_subplot(9,1,5)
lines5 = plt.hist(x, density=True, alpha= 0.75, color="white")
plt.title('Dot/Dash histogram')
ax6 = fig1.add_subplot(9,1,6)
lines6 = plt.hist(x, density=True, alpha= 0.75, color="white")
plt.title('Spaces histogram')
up_2 = np.random.randn(200)
down_2 = np.random.randn(200)
ax8 = fig1.add_subplot(3,1,3)
lines8 = plt.hist2d(up_2, down_2)
plt.title('2D histogram')
y_buf = np.zeros(CHUNK*2)
time_base = 0
count = 0
trig_count = 0
t_up = 0
t_down = 0
binary_b4 = 0
up = []
down = []
p = pyaudio.PyAudio()
def callback(in_data, frame_count, time_info, status):
global y_buf, z_buf, window, yy
global time_base, count, trig_count, t_up, t_down, binary_b4, up, down
global ax6, ax7, lines6, lines7
y = np.frombuffer(in_data, dtype="int16")
for i in range(CHUNK):
y_buf[i ] = y_buf[i+CHUNK]
y_buf[i+CHUNK] = y [i]
analytic_signal = hilbert(y_buf)
envelope = np.abs(analytic_signal)
nmedian = 51
medsignal = medfilt(envelope, nmedian)
y_max = max(1.1 * max(abs(y.min()), abs(y.max())), 100.0)
y_buf_max = max(1.1 * max(abs(y_buf.min()), abs(y_buf.max())), 100.0)
envelope_max = max(1.1 * abs(envelope.max()) , 100.0)
medsignal_max = max(1.1 * abs(medsignal.max()), 100.0)
th = 0.4*medsignal_max
for i in range(CHUNK):
if medsignal[i+CHUNK//2] > th:
binary[i] = 1
else:
binary[i] = 0
for i in range(CHUNK):
if binary_b4 == 0 and binary[i] == 1:
if trig_count == 0:
trig_pos = i
trig_count += 1
t_up = i+count*CHUNK
t_down_duration = t_up - t_down
if trig_count > 1:
down.append(t_down_duration)
if binary_b4 == 1 and binary[i] == 0 and trig_count > 0:
t_down = i+count*CHUNK
t_up_duration = t_down - t_up
up.append(t_up_duration)
binary_b4 = binary[i]
print('count =', count, ', len(up)=', len(up), ', len(down) =', len(down))
if count%10 == 0:
ax1.set_ylim(-y_buf_max, y_buf_max)
ax2.set_ylim(-0.1*envelope_max, envelope_max)
ax3.set_ylim(-0.1*medsignal_max, medsignal_max)
ax4.set_ylim(-0.1, 1.1)
ax5.set_xlim((0,2000))
ax6.set_xlim((0,2000))
lines1.set_data(xx,y_buf)
lines2.set_data(xx,envelope)
lines3.set_data(xx,medsignal)
lines4.set_data(x,binary)
ax5.hist(up, density=True, alpha=0.75, color="coral")
ax6.hist(down, density=True, alpha=0.75, color="darkblue")
'''
if len(up) > 200 and len(down) > 200:
for i in range(200):
up_2[i] = up[i]
down_2[i] = down[i]
ax8.hist2d(up_2, down_2)
'''
if len(up) == len(down):
ax8.hist2d(up,down)
print('*')
count += 1
return (None, pyaudio.paContinue)
stream = p.open(format=FORMAT, channels=CHANNELS, rate=RATE,
input=True, frames_per_buffer=CHUNK,
stream_callback=callback)
stream.start_stream()
while stream.is_active():
plt.pause (0.01)
time.sleep(0.01)
stream.stop_stream()
stream.close()
p.terminate()
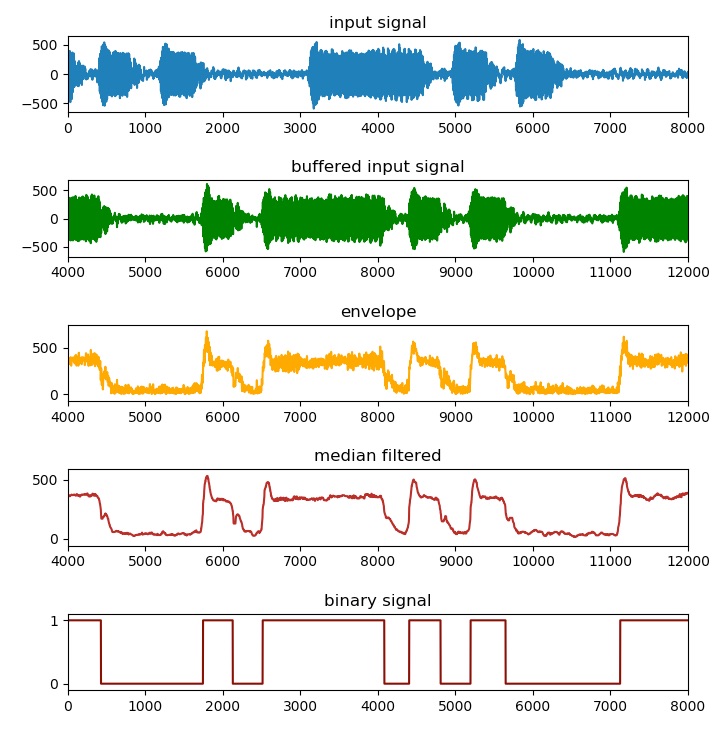
import pyaudio
import numpy as np
import matplotlib.pyplot as plt
import time
import sys
from scipy.signal import hilbert
from scipy.signal import medfilt
from sklearn.cluster import KMeans

CHUNK    = 8001
FORMAT   = pyaudio.paInt16
CHANNELS = 1
RATE     = 8000

x  = range   (CHUNK)
y  = np.zeros(CHUNK)
binary = np.zeros(CHUNK)
xx = range   (CHUNK*2)
yy = np.zeros(CHUNK*2)

fig = plt.figure(1, figsize=(8, 16))
plt.subplots_adjust(hspace=0.9, wspace=0.1)

ax1  = plt.subplot(9,1,1)
ax1.set_xlim(0, CHUNK)
lines1, = plt.plot(x,y)
plt.title('input signal')

ax2  = plt.subplot(9,1,2)
ax2.set_xlim(CHUNK/2,CHUNK+CHUNK/2)
lines2, = plt.plot(xx,yy, color="green")
plt.title('buffered input signal')

ax3  = plt.subplot(9,1,3)
ax3.set_xlim(CHUNK/2,CHUNK+CHUNK/2)
lines3, = plt.plot(xx,yy, color="orange")
plt.title('envelope')

ax4  = plt.subplot(9,1,4)
ax4.set_xlim(CHUNK/2,CHUNK+CHUNK/2)
lines4, = plt.plot(xx,yy, color="firebrick")
plt.title('median filtered')

ax5  = plt.subplot(9,1,5)
ax5.set_xlim(0, CHUNK)
lines5, = plt.plot(x,y, color="maroon")
plt.title('binary signal')

y_buf  = np.zeros(CHUNK*2)

time_base = 0
count = 0
trig_count = 0
t_up       = 0

p = pyaudio.PyAudio()

def callback(in_data, frame_count, time_info, status):
    global y_buf, z_buf, window, yy
    global time_base, count, trig_count, t_up, t_down, t_b4, up, down

    y = np.frombuffer(in_data, dtype="int16")

    for i in range(CHUNK):
        y_buf[i      ] = y_buf[i+CHUNK]
        y_buf[i+CHUNK] = y    [i]

    analytic_signal = hilbert(y_buf)
    envelope = np.abs(analytic_signal)
    nmedian = 51
    medsignal = medfilt(envelope, nmedian)

    y_max          = max(1.1 * max(abs(y.min()),     abs(y.max())),     100.0)
    y_buf_max      = max(1.1 * max(abs(y_buf.min()), abs(y_buf.max())), 100.0)
    envelope_max   = max(1.1 * abs(envelope.max()) , 100.0)
    medsignal_max  = max(1.1 * abs(medsignal.max()), 100.0)
    th = 0.4*medsignal_max

    for i in range(CHUNK):
        if medsignal[i+CHUNK//2] > th:
            binary[i] = 1
        else:
            binary[i] = 0

    print('count =', count)

    if count%10 == 0:
        ax1.set_ylim(-y_max, y_max)
        ax2.set_ylim(-y_buf_max, y_buf_max)
        ax3.set_ylim(-0.1*envelope_max, envelope_max)
        ax4.set_ylim(-0.1*medsignal_max, medsignal_max)
        ax5.set_ylim(-0.1, 1.1)
        lines1.set_data(x,y) # input signal
        lines2.set_data(xx,y_buf)
        lines3.set_data(xx,envelope)
        lines4.set_data(xx,medsignal)
        lines5.set_data(x,binary)
        print('*')

    count += 1

    return (None, pyaudio.paContinue)

stream  = p.open(format=FORMAT, channels=CHANNELS, rate=RATE,
                input=True, frames_per_buffer=CHUNK,
                stream_callback=callback)

stream.start_stream()

while stream.is_active():
	plt.pause (0.01)
	time.sleep(0.01)

stream.stop_stream()
stream.close()
p.terminate()
オーディオ・ストリームは、コールバック・モードで取得されます。
ダブルバッファと窓関数とが、ブロック単位の入力信号を処理するために用いられます。
窓関数無しだと、ブロックの境界でグリッチが発生することがあります。
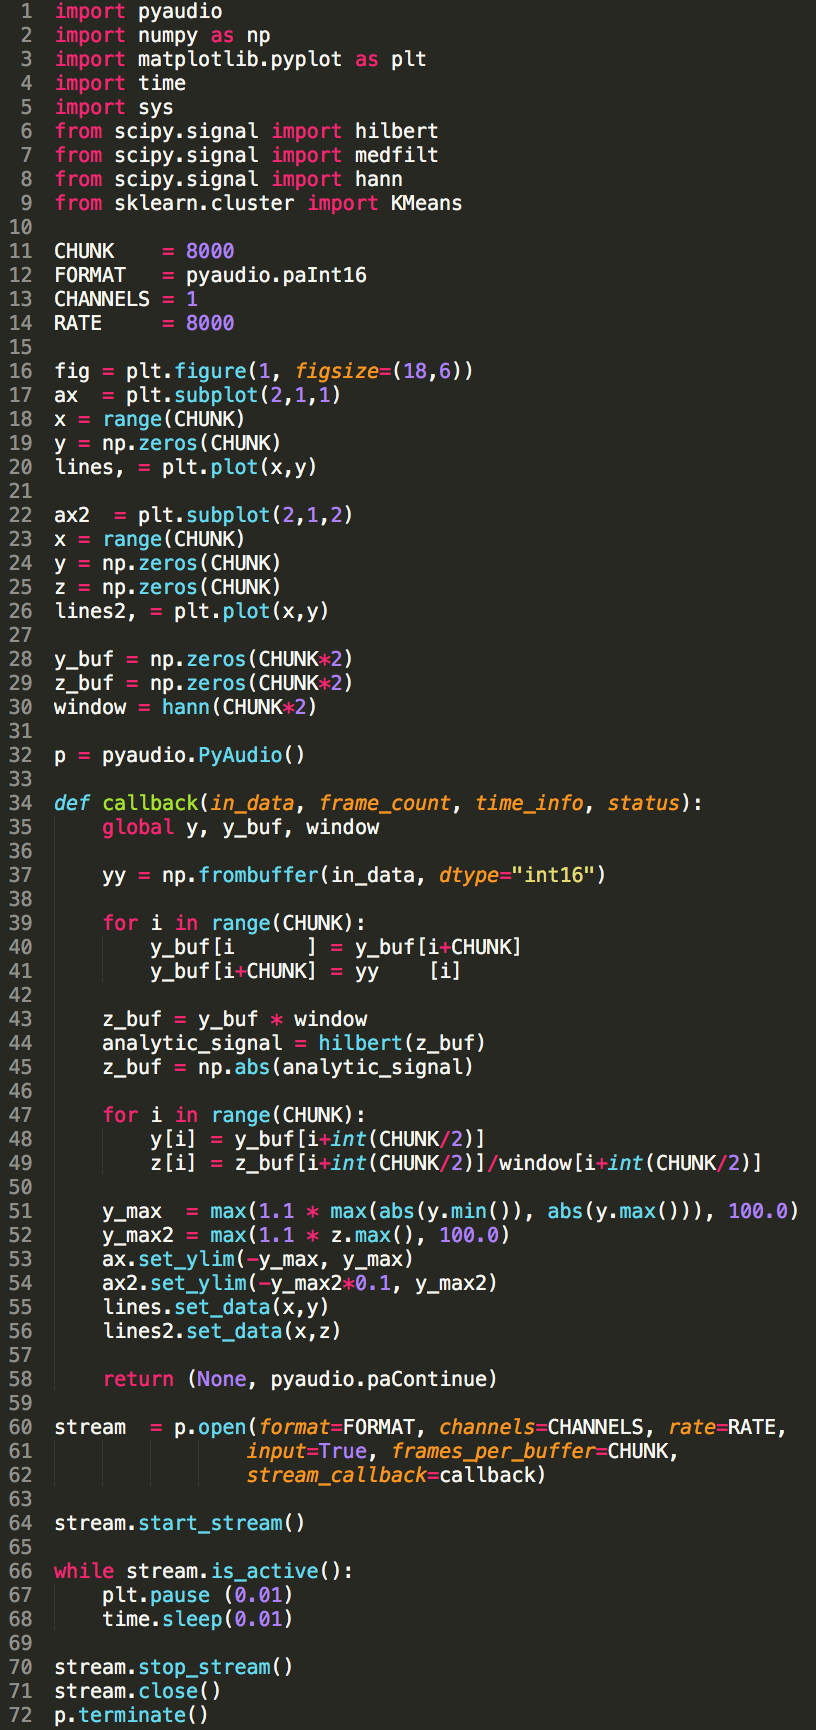
import pyaudio
import numpy as np
import matplotlib.pyplot as plt
import time
import sys
from scipy.signal import hilbert
from scipy.signal import medfilt
from scipy.signal import hann
from sklearn.cluster import KMeans

CHUNK    = 8000
FORMAT   = pyaudio.paInt16
CHANNELS = 1
RATE     = 8000

fig = plt.figure(1, figsize=(18,6))
ax  = plt.subplot(2,1,1)
x = range(CHUNK)
y = np.zeros(CHUNK)
lines, = plt.plot(x,y)

ax2  = plt.subplot(2,1,2)
x = range(CHUNK)
y = np.zeros(CHUNK)
z = np.zeros(CHUNK)
lines2, = plt.plot(x,y)

y_buf = np.zeros(CHUNK*2)
z_buf = np.zeros(CHUNK*2)
window = hann(CHUNK*2)

p = pyaudio.PyAudio()

def callback(in_data, frame_count, time_info, status):
    global y, y_buf, window

    yy = np.frombuffer(in_data, dtype="int16")

    for i in range(CHUNK):
        y_buf[i      ] = y_buf[i+CHUNK]
        y_buf[i+CHUNK] = yy    [i]

    z_buf = y_buf * window
    analytic_signal = hilbert(z_buf)
    z_buf = np.abs(analytic_signal)

    for i in range(CHUNK):
        y[i] = y_buf[i+int(CHUNK/2)]
        z[i] = z_buf[i+int(CHUNK/2)]/window[i+int(CHUNK/2)]

    y_max  = max(1.1 * max(abs(y.min()), abs(y.max())), 100.0)
    y_max2 = max(1.1 * z.max(), 100.0)
    ax.set_ylim(-y_max, y_max)
    ax2.set_ylim(-y_max2*0.1, y_max2)
    lines.set_data(x,y)
    lines2.set_data(x,z)

    return (None, pyaudio.paContinue)

stream  = p.open(format=FORMAT, channels=CHANNELS, rate=RATE,
                input=True, frames_per_buffer=CHUNK,
                stream_callback=callback)

stream.start_stream()

while stream.is_active():
	plt.pause (0.01)
	time.sleep(0.01)

stream.stop_stream()
stream.close()
p.terminate()
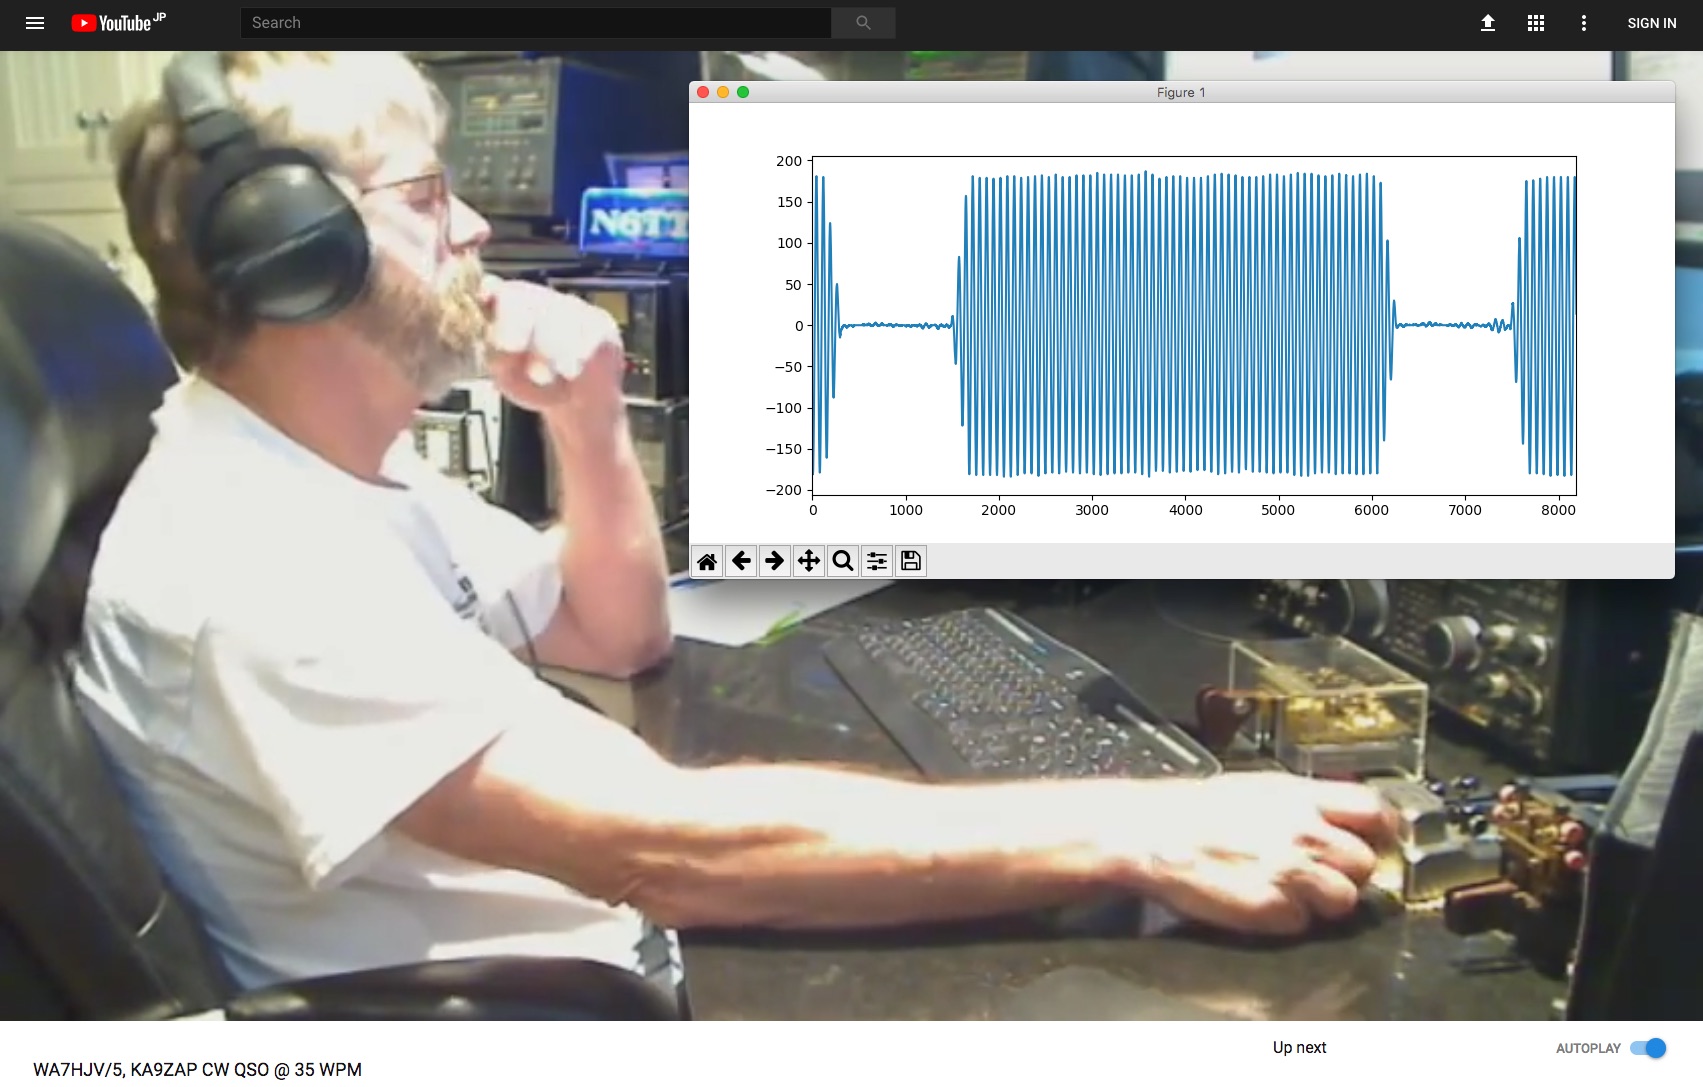
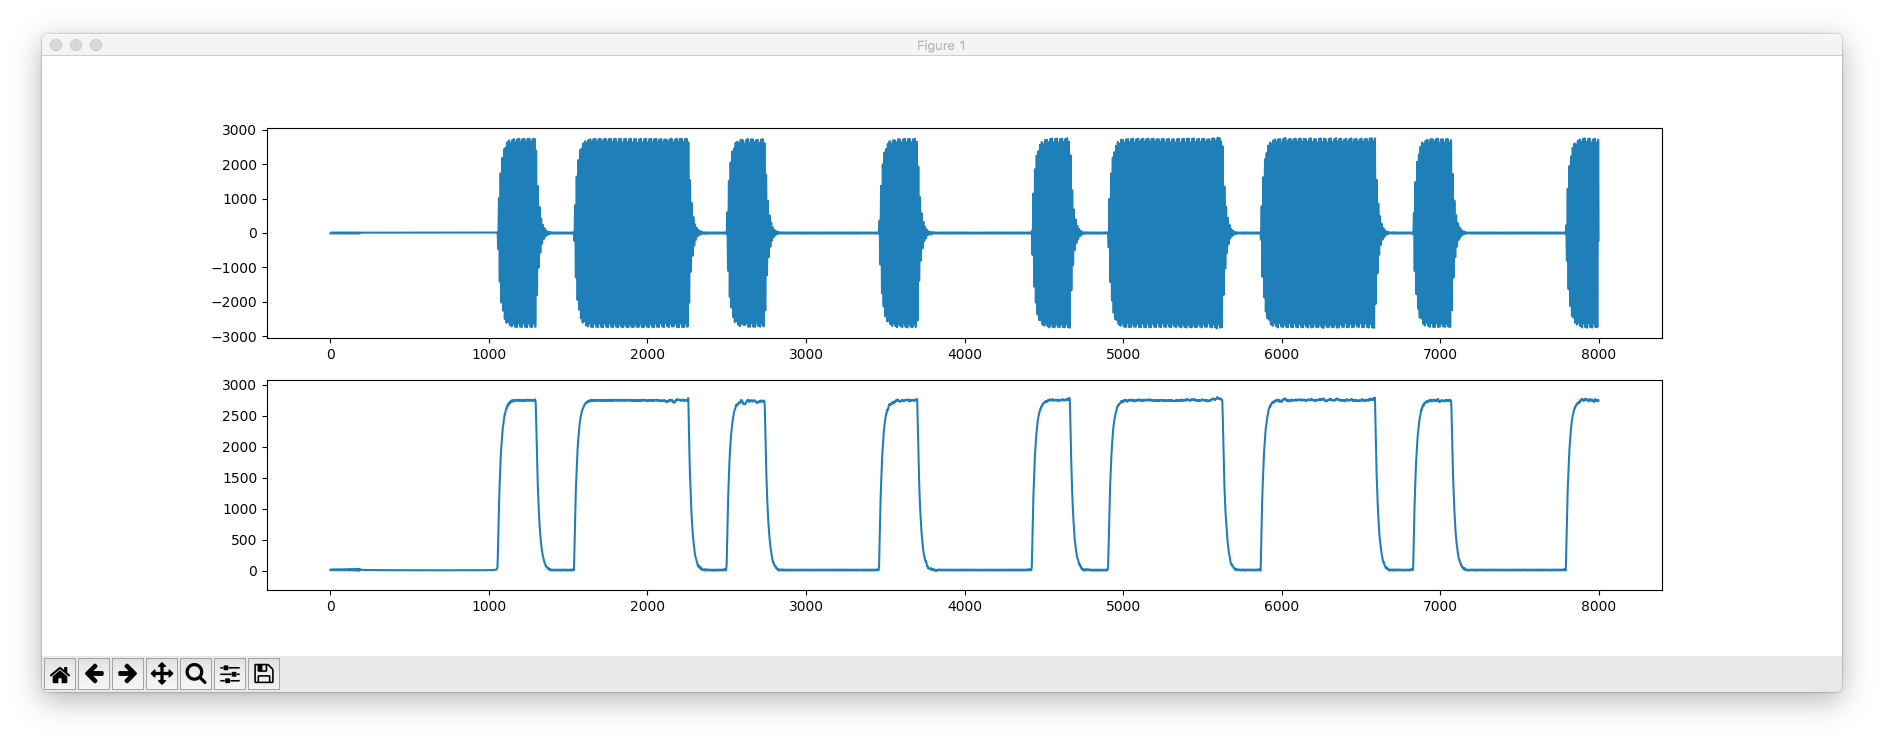
私は、Soundflowerを使って、アプリケーションからのサウンドをリダイレクトしています。

import pyaudio
import numpy as np
import matplotlib.pyplot as plt

CHUNK    = 8192
FORMAT   = pyaudio.paInt16
CHANNELS = 1
RATE     = 44100

p = pyaudio.PyAudio()
stream = p.open(format=FORMAT, channels=CHANNELS, rate=RATE,
                input=True, frames_per_buffer=CHUNK)

fig = plt.figure(1, figsize=(18,6))
ax  = plt.subplot(1,1,1)
ax.set_xlim(0, CHUNK-1)

x = range(CHUNK)
y = np.zeros(CHUNK)

lines, = plt.plot(x,y)

for i in range(5000):
    data = stream.read(CHUNK, exception_on_overflow = False)
    y = np.frombuffer(data, dtype="int16")
    y_max = 1.1 * max(abs(y.min()), abs(y.max()))
    ax.set_ylim(-y_max, y_max)
    lines.set_data(x,y)
    plt.pause(1)

stream.stop_stream()
stream.close()
p.terminate()
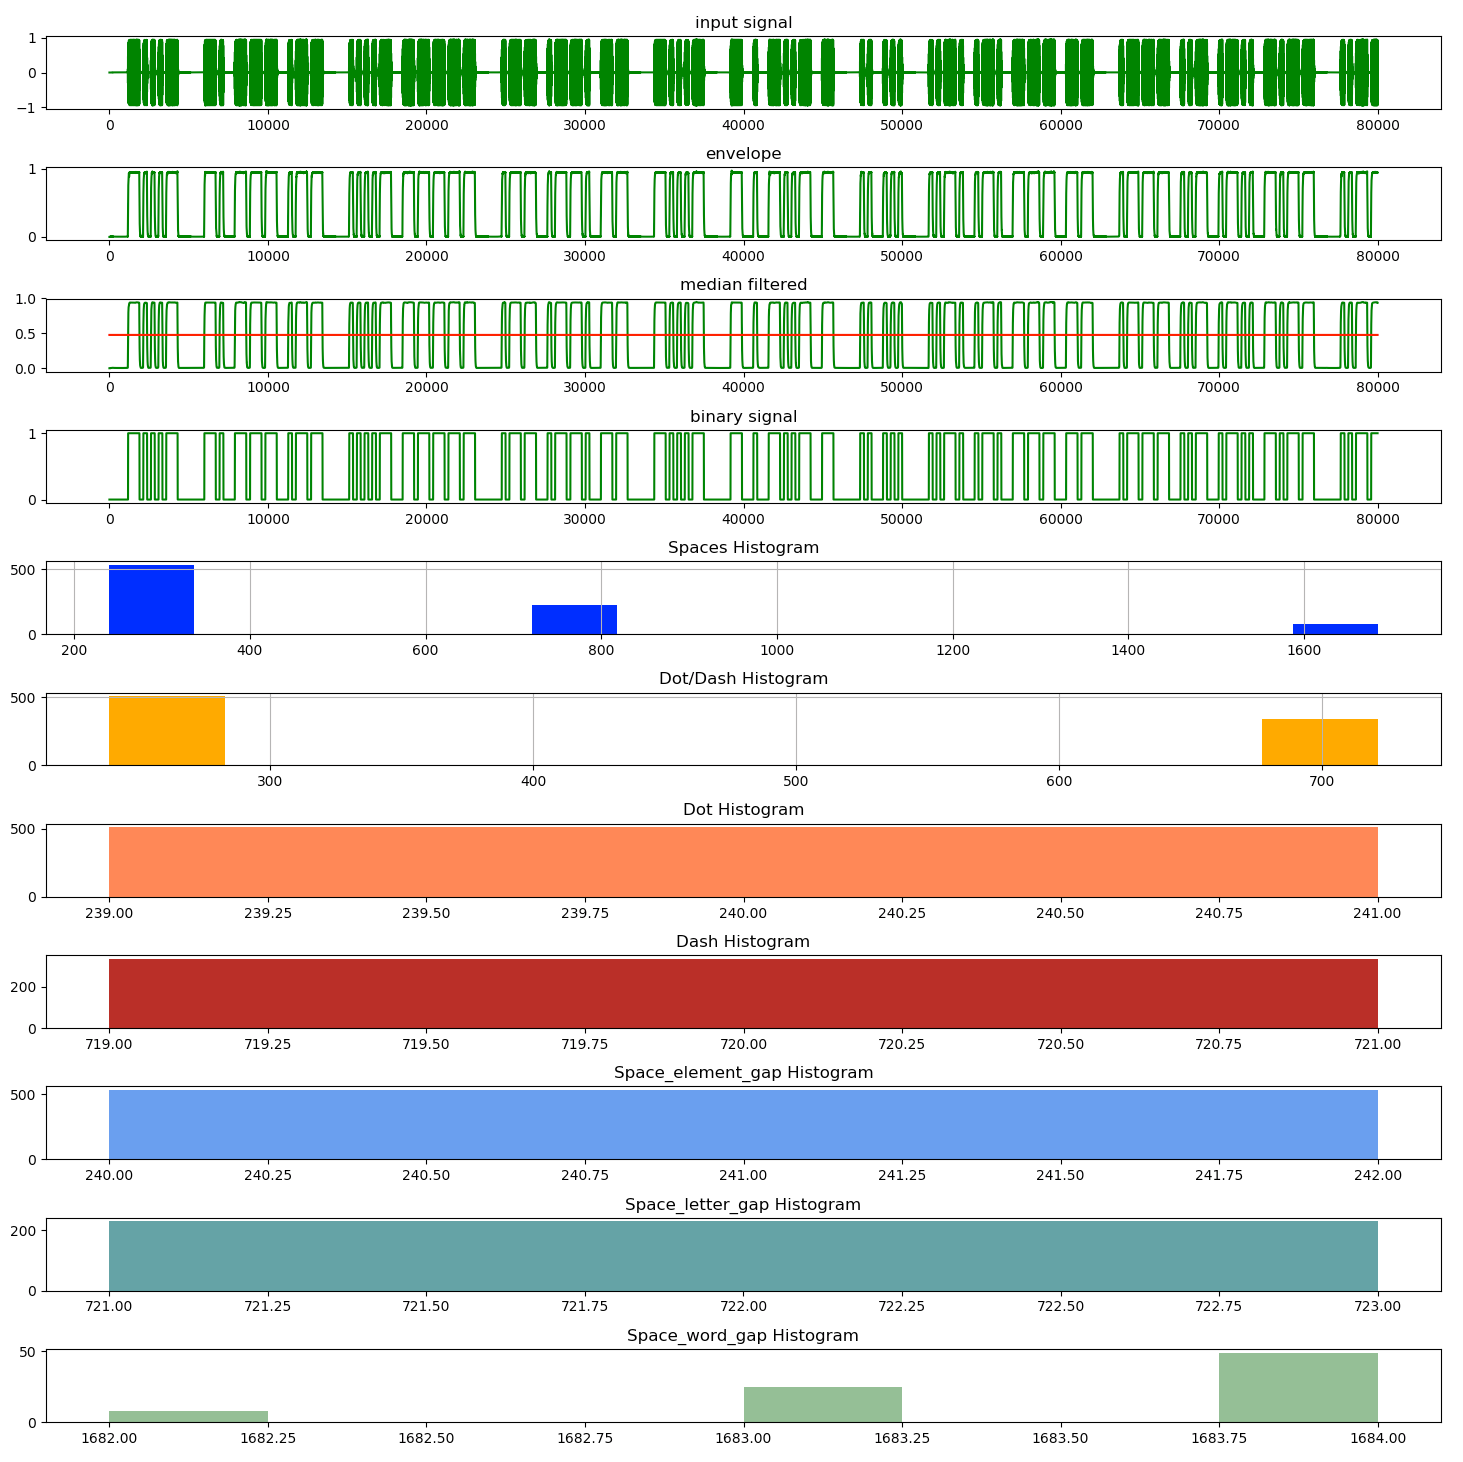
$ ~/anaconda3/bin/python test9.py 40wpm.wav 0 800000 57 1.0

wpm = 39.93344425956739 , t_dd = 480.0 , t_ls = 482.5 t_ws = 1203.5

<BT>
 NOW 40 WPM
<BT>
 TEXT IS FROM JULY 2014 QST PAGE 36
<BT>
 THE SENS POT FOR A METER READING OF S 9.
 6.
 REPEAT STEPS 4 AND 5 UNTIL BOTH READINGS CAN BE ACHIEVED WITHOUT FURTHER ADJUSTMENT.
 7.
 SET THE RECEIVER RF GAIN FULLY CCW AND ADJUST THE CLAMP POT FOR A FULL SCALE READING ON THE S METER.
 TEST RESULTS FIGURE 4 IS A GRAPH SHOWING THE VALUE OF AN S UNIT OVER THE ENTIRE S METER RANGE.
import sys
import numpy as np
import matplotlib.pyplot as plt
import soundfile as sf
from scipy.signal import hilbert
from scipy.signal import medfilt
from sklearn.cluster import KMeans

morse ={
	"" : "",
	"A" : ".-",
	"B" : "-...",
	"C" : "-.-.",
	"D" : "-..",
	"E" : ".",
	"F" : "..-.",
	"G" : "--.",
	"H" : "....",
	"I" : "..",
	"J" : ".---",
	"K" : "-.-",
	"L" : ".-..",
	"M" : "--",
	"N" : "-.",
	"O" : "---",
	"P" : ".--.",
	"Q" : "--.-",
	"R" : ".-.",
	"S" : "...",
	"T" : "-",
	"U" : "..-",
	"V" : "...-",
	"W" : ".--",
	"X" : "-..-",
	"Y" : "-.--",
	"Z" : "--..",
	"1" : ".----",
	"2" : "..---",
	"3" : "...--",
	"4" : "....-",
	"5" : ".....",
	"6" : "-....",
	"7" : "--...",
	"8" : "---..",
	"9" : "----.",
	"0" : "-----",
	".\n" : ".-.-.-",
	"," : "--..--",
	":" : "---...",
	"?" : "..--..",
	"'" : ".----.",
	"-" : "-....-",
	"/" : "-..-.",
	"@" : ".--.-.",
	"\n<BT>\n" : "-...-",
	"<SN>" : "...-.",
	"<KN>" : "-.--."
}

morse_inv = dict((v,k) for (k,v) in morse.items())

filename = sys.argv[1]
nstart   = int(sys.argv[2])
nframes  = int(sys.argv[3])
nmedian  = int(sys.argv[4])
th_amp   = float(sys.argv[5])
print(filename, nstart, nframes, nmedian, th_amp)

wav, fs  = sf.read(filename,start=nstart,frames=nframes)
nsamples = wav.shape[0]
print('fs =', fs, ' nsasmples =', nsamples)
trig_pos = 0

analytic_signal = hilbert(wav)
env1 = np.abs(analytic_signal)

n_suppress = 50 # to delete initial unstable part
if len(env1) > n_suppress:
	for i in range(n_suppress):
		env1[i] = 0

env2 = medfilt(env1, nmedian)

env_max = max(env2)
th = 0.5*env_max*th_amp
print('env_max =', env_max, 'th_amp =', th_amp, 'th =', th)

env = np.empty_like(env2)
for i in range(len(env-1)):
	if env2[i] > th:
		env[i] = 1
	else:
		env[i] = 0

trig_count = 0
t_up = 0
t_down = 0
up = []
down = []

for t in range(1, len(env-1)):
	if env[t-1] == 0 and env[t] == 1:
		if trig_count == 0:
			trig_pos = t
		trig_count += 1
		t_up = t
		t_down_duration = t - t_down
		if trig_count > 1:
			down.append(t_down_duration)
	if env[t-1] == 1 and env[t] == 0 and  trig_count > 0:
		t_down = t
		t_up_duration = t - t_up
		up.append(t_up_duration)

print('trig_pos =', trig_pos)
print('down =', down)
print('up =', up)

kmeans_up = KMeans(n_clusters=2).fit(np.array(up).reshape(-1,1))
print('labels =', kmeans_up.labels_)
print('centers =', kmeans_up.cluster_centers_)
print('center0 =', kmeans_up.cluster_centers_[0,0])
print('center1 =', kmeans_up.cluster_centers_[1,0])

if kmeans_up.cluster_centers_[0,0] < kmeans_up.cluster_centers_[1,0]:
	dot_id = 0
else:
	dot_id = 1

dot = []
dash = []
for i in range(len(kmeans_up.labels_)):
	if kmeans_up.labels_[i] == dot_id:
		dot.append(up[i])
	else:
		dash.append(up[i])

dot_mean    = np.mean(dot)
dot_median  = np.median(dot)
dot_min     = np.amin(dot)
dot_max     = np.amax(dot)
dot_std     = np.std(dot)

dash_mean   = np.mean(dash)
dash_median = np.median(dash)
dash_min    = np.amin(dash)
dash_max    = np.amax(dash)
dash_std    = np.std(dash)

dot_dash_ratio_mean   = dash_mean   / dot_mean
dot_dash_ratio_median = dash_median / dot_median

print('dot =', dot)
print('dot_mean =', dot_mean, ', dot_median =', dot_median)
print('dot_min =', dot_min, ', dot_max =', dot_max, ', dot_std =', dot_std)

print('dash =', dash)
print('dash_mean =', dash_mean, ', dash_median =', dash_median)
print('dash_min =', dash_min, ', dash_max =', dash_max, ', dash_std =', dash_std)

print('dot_dash_ratio_mean ='  , dot_dash_ratio_mean)
print('dot_dash_ratio_median =', dot_dash_ratio_median)

kmeans_down = KMeans(n_clusters=3,
	init=np.array([dot_median, dot_median*3, dot_median*7]).reshape(-1,1),
	n_init=1, max_iter=100).fit(np.array(down).reshape(-1,1))
print('labels =', kmeans_down.labels_)
print('centers =', kmeans_down.cluster_centers_)

sp0 = []
sp1 = []
sp2 = []
for i in range(len(kmeans_down.labels_)):
	if kmeans_down.labels_[i] == 0:
		sp0.append(down[i])
	elif kmeans_down.labels_[i] == 1:
		sp1.append(down[i])
	else:
		sp2.append(down[i])

sp0_mean    = np.mean(sp0)
sp0_median  = np.median(sp0)
sp0_min     = np.amin(sp0)
sp0_max     = np.amax(sp0)
sp0_std     = np.std(sp0)

sp1_mean    = np.mean(sp1)
sp1_median  = np.median(sp1)
sp1_min     = np.amin(sp1)
sp1_max     = np.amax(sp1)
sp1_std     = np.std(sp1)

sp2_mean    = np.mean(sp2)
sp2_median  = np.median(sp2)
sp2_min     = np.amin(sp2)
sp2_max     = np.amax(sp2)
sp2_std     = np.std(sp2)

print('sp0 =', sp0)
print('sp0_mean =', sp0_mean, ', sp0_median =', sp0_median)
print('sp0_min =', sp0_min, ', sp0_max =', sp0_max, ', sp0_std =', sp0_std)

print('sp1 =', sp1)
print('sp1_mean =', sp1_mean, ', sp1_median =', sp1_median)
print('sp1_min =', sp1_min, ', sp1_max =', sp1_max, ', sp1_std =', sp1_std)

print('sp2 =', sp2)
print('sp2_mean =', sp2_mean, ', sp2_median =', sp2_median)
print('sp2_min =', sp2_min, ', sp2_max =', sp2_max, ', sp2_std =', sp2_std)


plt.figure(1, figsize=(18,18))

plt.subplot(11,1,1)
trig_pos = 0
disp_pos1 = max([0,trig_pos-int(fs/100)])
disp_pos2 = disp_pos1 + 10*int(fs)
print('disp_pos1 =', disp_pos1, 'dsip_pos2 =', disp_pos2)
plt.plot(wav[disp_pos1:disp_pos2], color='green')
plt.title("input signal")

plt.subplot(11,1,2)
plt.plot(env1[disp_pos1:disp_pos2], color='green')
plt.title("envelope")

plt.subplot(11,1,3)
plt.plot(env2[disp_pos1:disp_pos2], color='green')
env_th = np.full(len(env2), th)
plt.plot(env_th[disp_pos1:disp_pos2], color='red')
plt.title("median filtered")

plt.subplot(11,1,4)
plt.plot(env[disp_pos1:disp_pos2], color='green')
plt.title("binary signal")

plt.subplot(11,1,5)
hist_down, bin_edges_down, patches_down = plt.hist(down, bins='auto', color="blue")
dotspace_arg = np.argmax(hist_down)
dotspace_len = bin_edges_down[dotspace_arg]
print('dotspace_len =', dotspace_len)
print('hist_down =', hist_down)
print('bin_edges_down =', bin_edges_down)
plt.title("Spaces Histogram")
plt.grid(True)

plt.subplot(11,1,6)
hist_up, bin_edges_up, patches_up = plt.hist(up, bins='auto', color="orange")
print('hist_up =', hist_up)
print('bin_edges_up =', bin_edges_up)
plt.title("Dot/Dash Histogram")
plt.grid(True)

plt.subplot(11,1,7)
hist_dot, bin_edges_dot, patches_dot = plt.hist(dot, bins='auto', color="coral")
print('hist_dot =', hist_dot)
print('bin_edges_dot =', bin_edges_dot)
plt.title("Dot Histogram")

plt.subplot(11,1,8)
hist_dash, bin_edges_dash, patches_dash = plt.hist(dash, bins='auto', color="firebrick")
print('hist_dash =', hist_dash)
print('bin_edges_dash =', bin_edges_dash)
plt.title("Dash Histogram")

plt.subplot(11,1,9)
hist_sp0, bin_edges_sp0, patches_sp0 = plt.hist(sp0, bins='auto', color="cornflowerblue")
print('hist_sp0 =', hist_sp0)
print('bin_edges_sp0 =', bin_edges_sp0)
plt.title("Space_element_gap Histogram")

plt.subplot(11,1,10)
hist_sp1, bin_edges_sp1, patches_sp1 = plt.hist(sp1, bins='auto', color="cadetblue")
print('hist_sp1 =', hist_sp1)
print('bin_edges_sp1 =', bin_edges_sp1)
plt.title("Space_letter_gap Histogram")

plt.subplot(11,1,11)
hist_sp2, bin_edges_sp2, patches_sp2 = plt.hist(sp2, bins='auto', color="darkseagreen")
print('hist_sp2 =', hist_sp2)
print('bin_edges_sp2 =', bin_edges_sp2)
plt.title("Space_word_gap Histogram")

t_unit = (np.median(dot)+np.median(dash)+np.median(sp0))/5
wpm  = 1200/(t_unit*(1.0/fs)*1000)
t_dd = (np.median(dot)+np.median(dash))/2.0
t_ls = (np.median(sp0)+np.median(sp1))/2.0
t_ws = (np.median(sp1)+np.median(sp2))/2.0
print('wpm =', wpm, ', t_dd =', t_dd, ', t_ls =', t_ls, 't_ws =', t_ws)

string = ''

for t in range(1, len(env-1)):
	if env[t-1] == 0 and env[t] == 1:
		t_up = t
		t_down_duration = t - t_down
		down.append(t_down_duration)
		if t_down_duration > t_ls:
#			print(morse_inv.get(string, '^'), end='')
			if string in morse_inv:
				print(morse_inv[string], end='')
			else:
				print(string, end='')
			string = ''
		if t_down_duration > t_ws:
			print(' ', end='')
	if env[t-1] == 1 and env[t] == 0:
		t_down = t
		t_up_duration = t - t_up
		up.append(t_up_duration)
		if t_up_duration < t_dd:
			string = string + '.'
		else:
			string = string + '-'

print('')

plt.subplots_adjust(hspace=0.8, wspace=0.6)
plt.show()
$ ~/anaconda3/bin/python test9.py 40wpm.wav 0 800000 57 1.0

40wpm.wav 0 800000 57 1.0
fs = 8000  nsasmples = 800000
env_max = 0.954811983795087 th_amp = 1.0 th = 0.4774059918975435
trig_pos = 1175
down = [242, 242,   , 242, 722]
up = [720, 240,   , 241, 240]
labels = [0 1 1 1     0 0 1 1]
centers = [[720.13609467] [240.14931238]]
center0 = 720.1360946745546
center1 = 240.14931237720856
dot = [240, 239,   , 241, 240]
dot_mean = 240.1493123772102 , dot_median = 240.0
dot_min = 239 , dot_max = 241 , dot_std = 0.38296808828471224
dash = [720, 720,   , 720, 720]
dash_mean = 720.1360946745563 , dash_median = 720.0
dash_min = 719 , dash_max = 721 , dash_std = 0.37582117179172586
dot_dash_ratio_mean = 2.9987014642932452
dot_dash_ratio_median = 3.0
labels = [0 0 0 0 2 0 1 0    ]
centers = [[ 241.82990654] [ 722.75982533] [1683.5       ]]
sp0 = [242, 242, 241,   , 242, 242]
sp0_mean = 241.82990654205608 , sp0_median = 242.0
sp0_min = 240 , sp0_max = 242 , sp0_std = 0.39035448861212213
sp1 = [722, 723,   , 723, 722]
sp1_mean = 722.759825327511 , sp1_median = 723.0
sp1_min = 721 , sp1_max = 723 , sp1_std = 0.4662888557540686
sp2 = [1684, 1684,   , 1684, 1684]
sp2_mean = 1683.5 , sp2_median = 1684.0
sp2_min = 1682 , sp2_max = 1684 , sp2_std = 0.6671746032482893
disp_pos1 = 0 dsip_pos2 = 80000
dotspace_len = 240.0
hist_down = [535.   0.   0.   0.   4. 225.   0.   0.   0.   0.   0.   0.   0.   0.
  82.]
bin_edges_down = [ 240.          336.26666667  432.53333333  528.8         625.06666667
  721.33333333  817.6         913.86666667 1010.13333333 1106.4
 1202.66666667 1298.93333333 1395.2        1491.46666667 1587.73333333
 1684.        ]
hist_up = [509.   0.   0.   0.   0.   0.   0.   0.   0.   0. 338.]
bin_edges_up = [239.         282.81818182 326.63636364 370.45454545 414.27272727
 458.09090909 501.90909091 545.72727273 589.54545455 633.36363636
 677.18181818 721.        ]
hist_dot = [509.]
bin_edges_dot = [239. 241.]
hist_dash = [338.]
bin_edges_dash = [719. 721.]
hist_sp0 = [535.]
bin_edges_sp0 = [240. 242.]
hist_sp1 = [229.]
bin_edges_sp1 = [721. 723.]
hist_sp2 = [ 8.  0.  0.  0. 25.  0.  0. 49.]
bin_edges_sp2 = [1682.   1682.25 1682.5  1682.75 1683.   1683.25 1683.5  1683.75 1684.  ]
wpm = 39.93344425956739 , t_dd = 480.0 , t_ls = 482.5 t_ws = 1203.5

うぅむ、これは難しい・・。
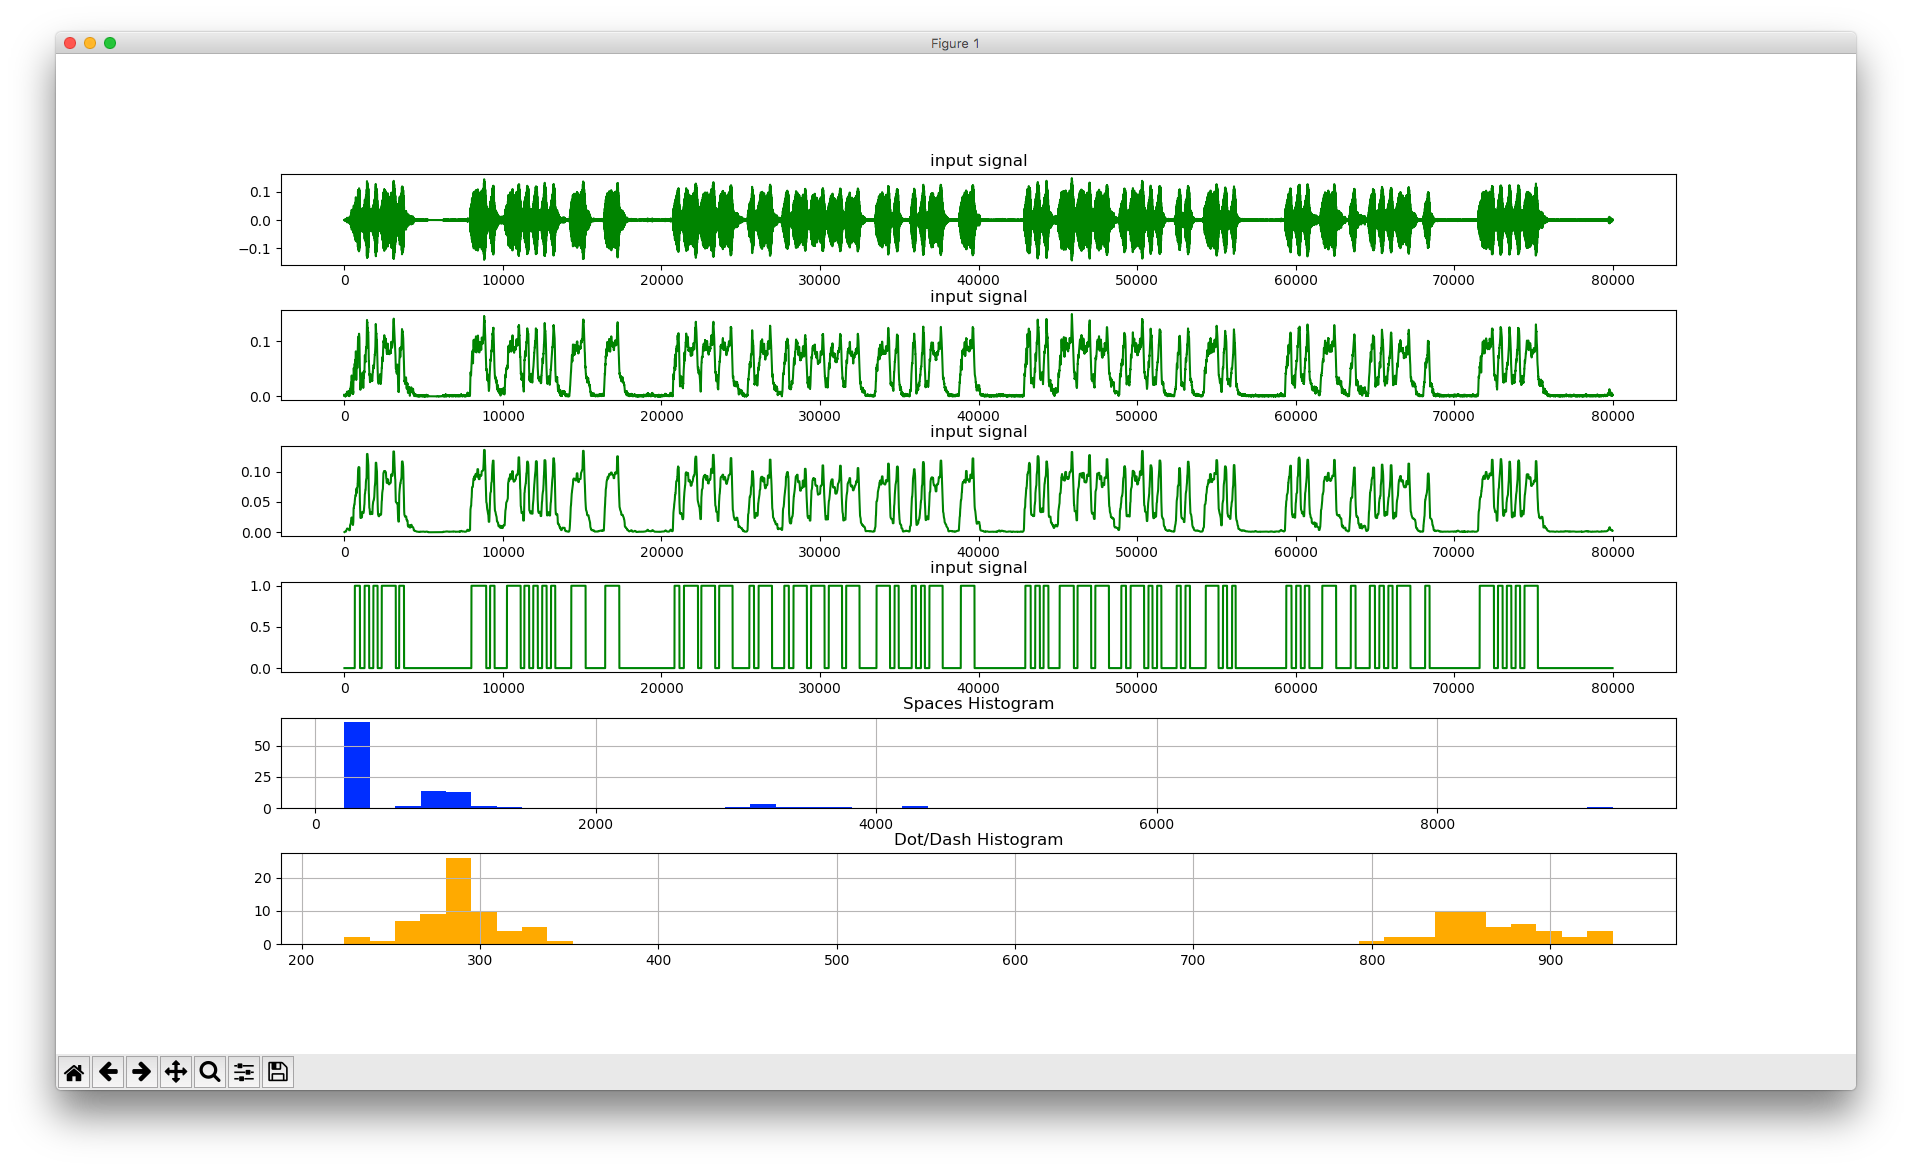
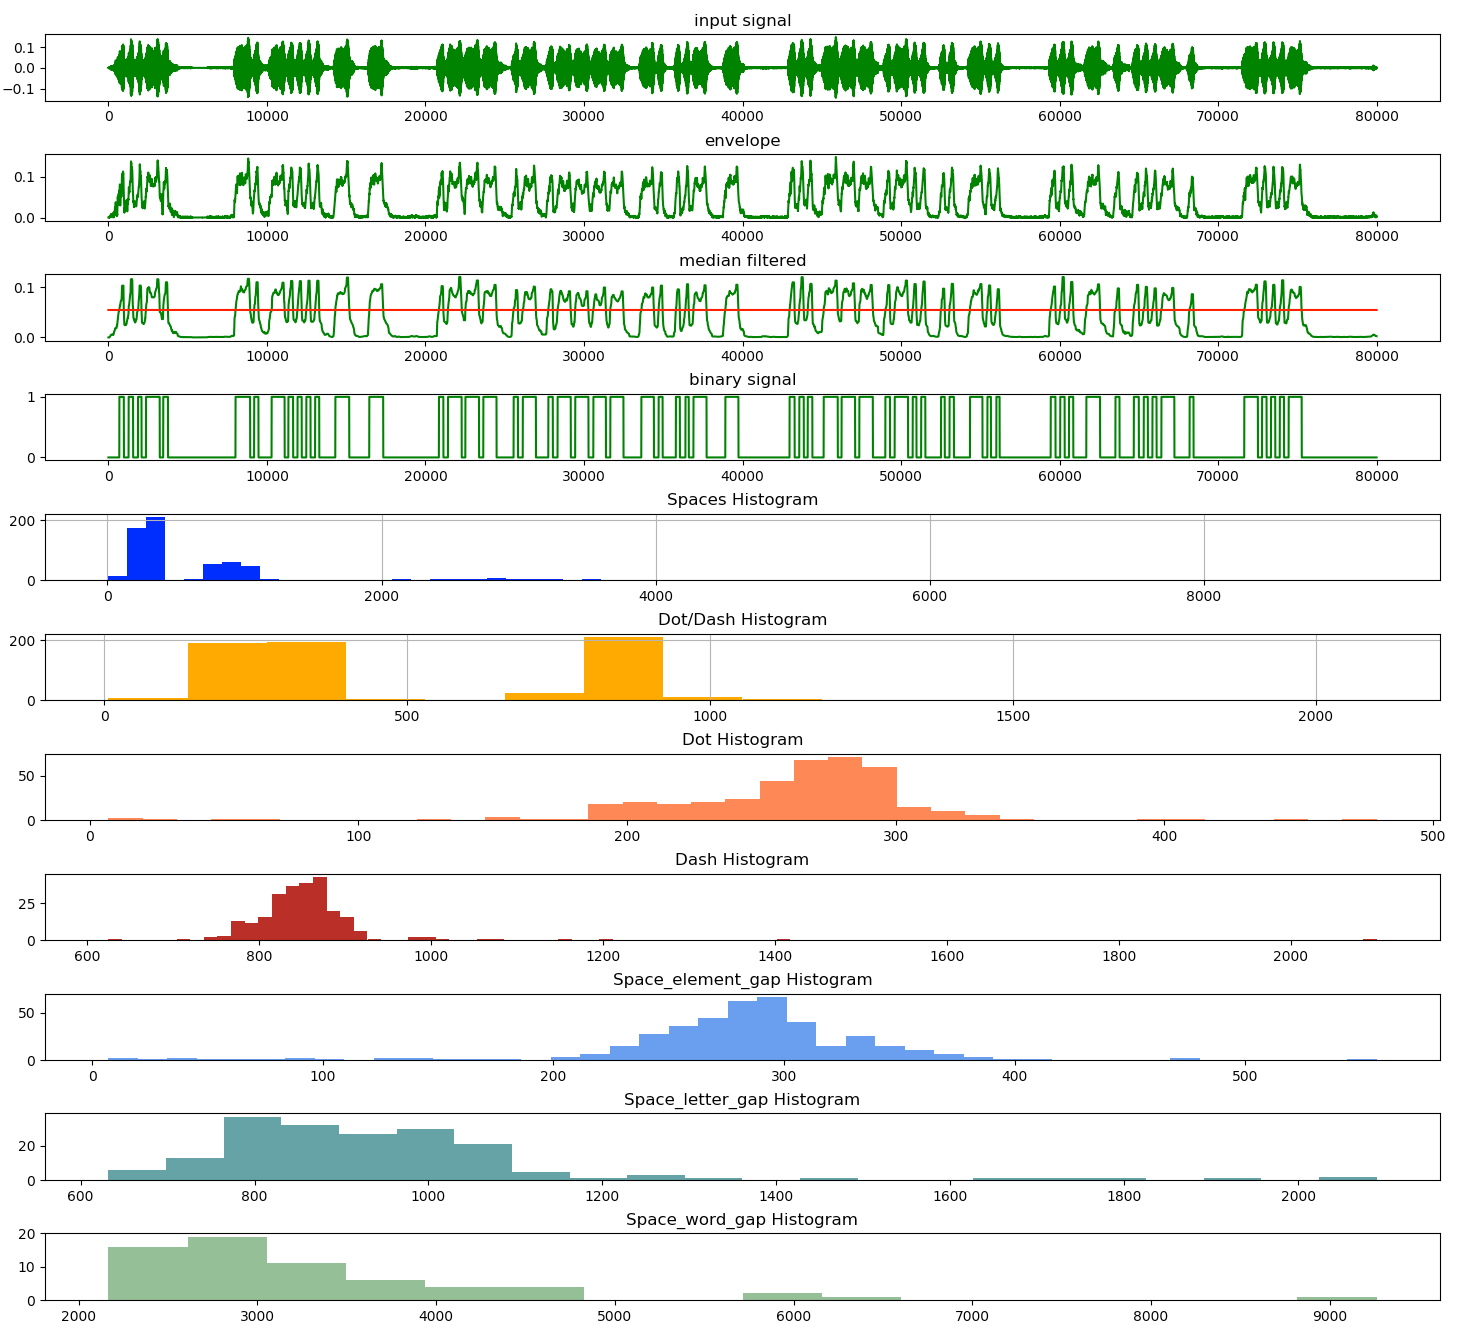
ヒストグラムは、必ずしも実際のキー操作に対応していないことに留意して下さい。受信信号には雑音が含まれるし、信号処理も行われています。
<SN>
N6TT
JA1NUT
SOLID
STEVE
<BT>
NO
THIS
QSO
WONT
DESERVE
^BLISSI
<SN>PUBLISHI<KN>
WID
USTREAM
AT
ALL