
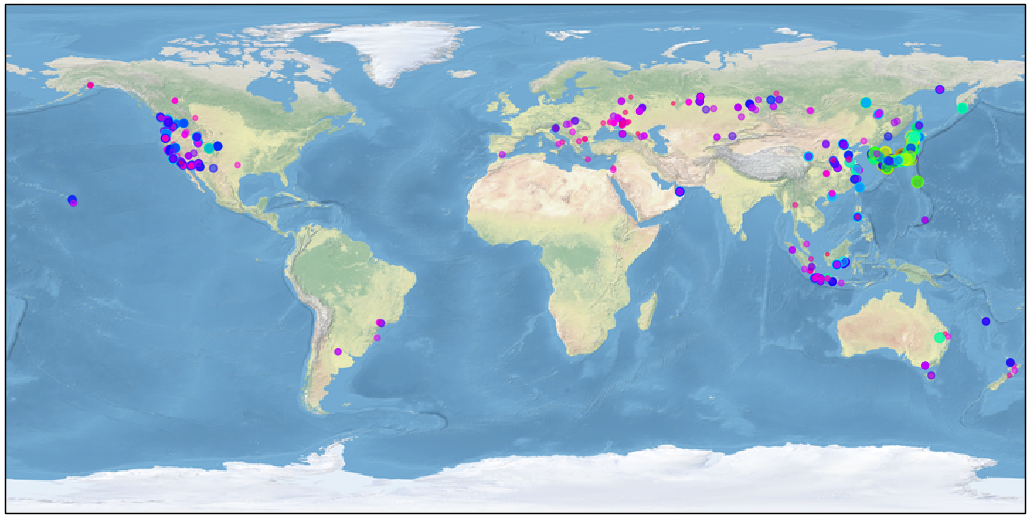
丸の色と大きさは、受信されたFT8信号のSNRを表しています。
import cartopy.crs as ccrs
import matplotlib.pyplot as plt
import numpy as np
import re
import datetime

def maiden2lonlat(maiden: str):
    n = len(maiden)
    maiden = maiden.lower()
    print(maiden, n)
    aaa = ord('a')
    lon = -180.0
    lat = -90.0

    lon += (ord(maiden[0])-aaa)*20.0
    lat += (ord(maiden[1])-aaa)*10.0
    lon += int(maiden[2])*2.0
    lat += int(maiden[3])*1.0
    if n >= 6:
        lon += (ord(maiden[4])-aaa) * 5.0/60.0
        lat += (ord(maiden[5])-aaa) * 2.5/60.0
    if n >= 8:
        lon += int(maiden[6]) * 5.0/600.0
        lat += int(maiden[7]) * 2.5/600.0
    return lon, lat


ax = plt.axes(projection=ccrs.PlateCarree())
ax.stock_img()

fnames = ['station1.adif']

def parse_adif(fn):
    raw = re.split('<eor>|<eoh>',open(fn).read() )
    raw.pop(0)
    raw.pop()
    logbook =[]
    for record in raw:
        qso = {}
        tags = re.findall('<(.*?):\d+.*?>([^<\t\n\r\f\v]+)',record)
        for tag in tags:
            qso[tag[0]] = tag[1]
        logbook.append(qso)
    return logbook

def mydatetime(date, time):
    dt = datetime.datetime(int(date[0:4]), int(date[4:6]), int(date[6:8]), \
                           int(time[0:2]), int(time[2:4]), int(time[4:6]))
    return dt

dt0 = datetime.datetime(2001,  1,  1,  0, 0 ,  0)
dt9 = datetime.datetime(2099, 12, 31, 23, 59, 59)

x = []
y = []
r = []
c = []
fcount = 0
for fn in fnames:
    log = parse_adif(fn)
    scount = 0
    for qso in log:
        if ('GRIDSQUARE' in qso):
            dt = mydatetime(qso['QSO_DATE'], qso['TIME_ON'])
            if dt >= dt0 and dt <=dt9:
                grid = qso['GRIDSQUARE']
                mylon, mylat = maiden2lonlat(grid)
                if ('APP_PSKREP_SNR' in qso):
                    snr = float(qso['APP_PSKREP_SNR'])
                    print(fcount, scount, grid, mylon, mylat, snr)
                    x.append(mylon)
                    y.append(mylat)
                    r.append(50.0+2.0*snr)
                    c.append(-snr*30.0)
                    scount += 1
    fcount += 1
plt.scatter(x, y, c=c, s=r, cmap='hsv', alpha=0.5)
plt.show()
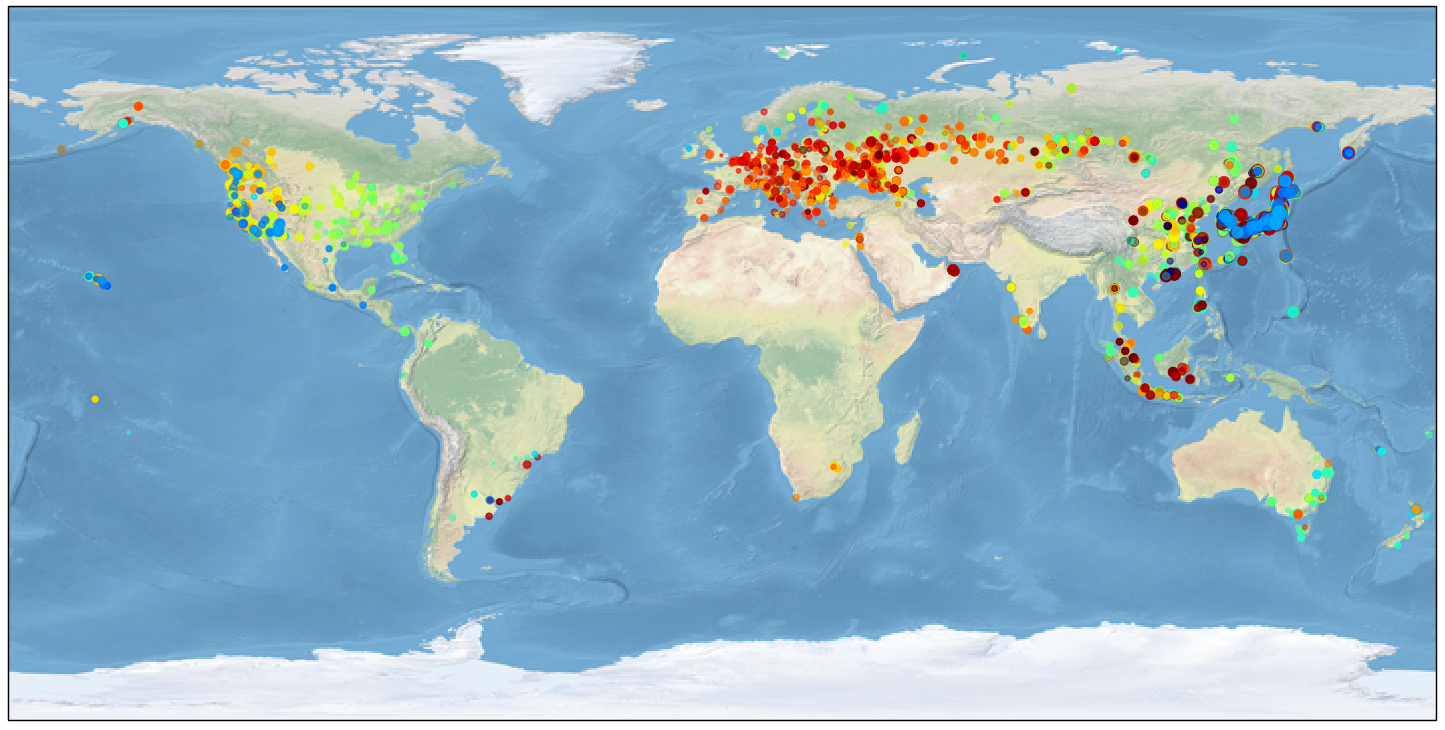
上の図では、大きさはSNRを、色は1日の時間を表しています。
![]()
カラーマップは、”jet”という名称のものを使いました。
左端が00Zに、右端が23Zに対応します。