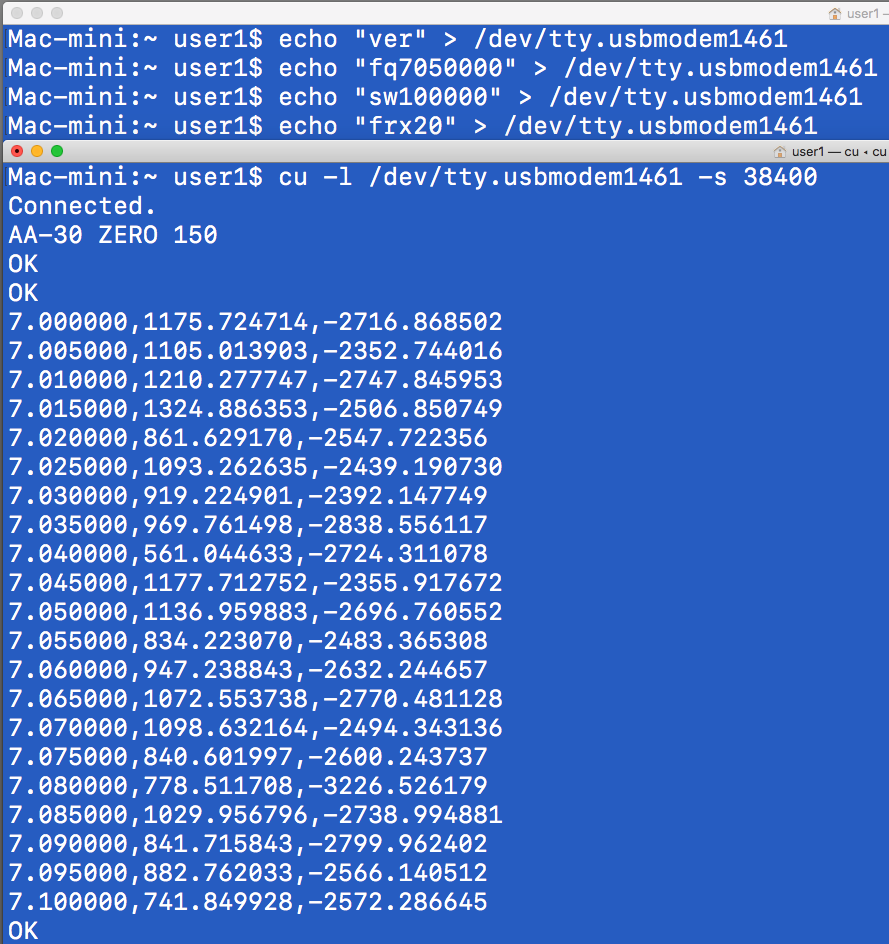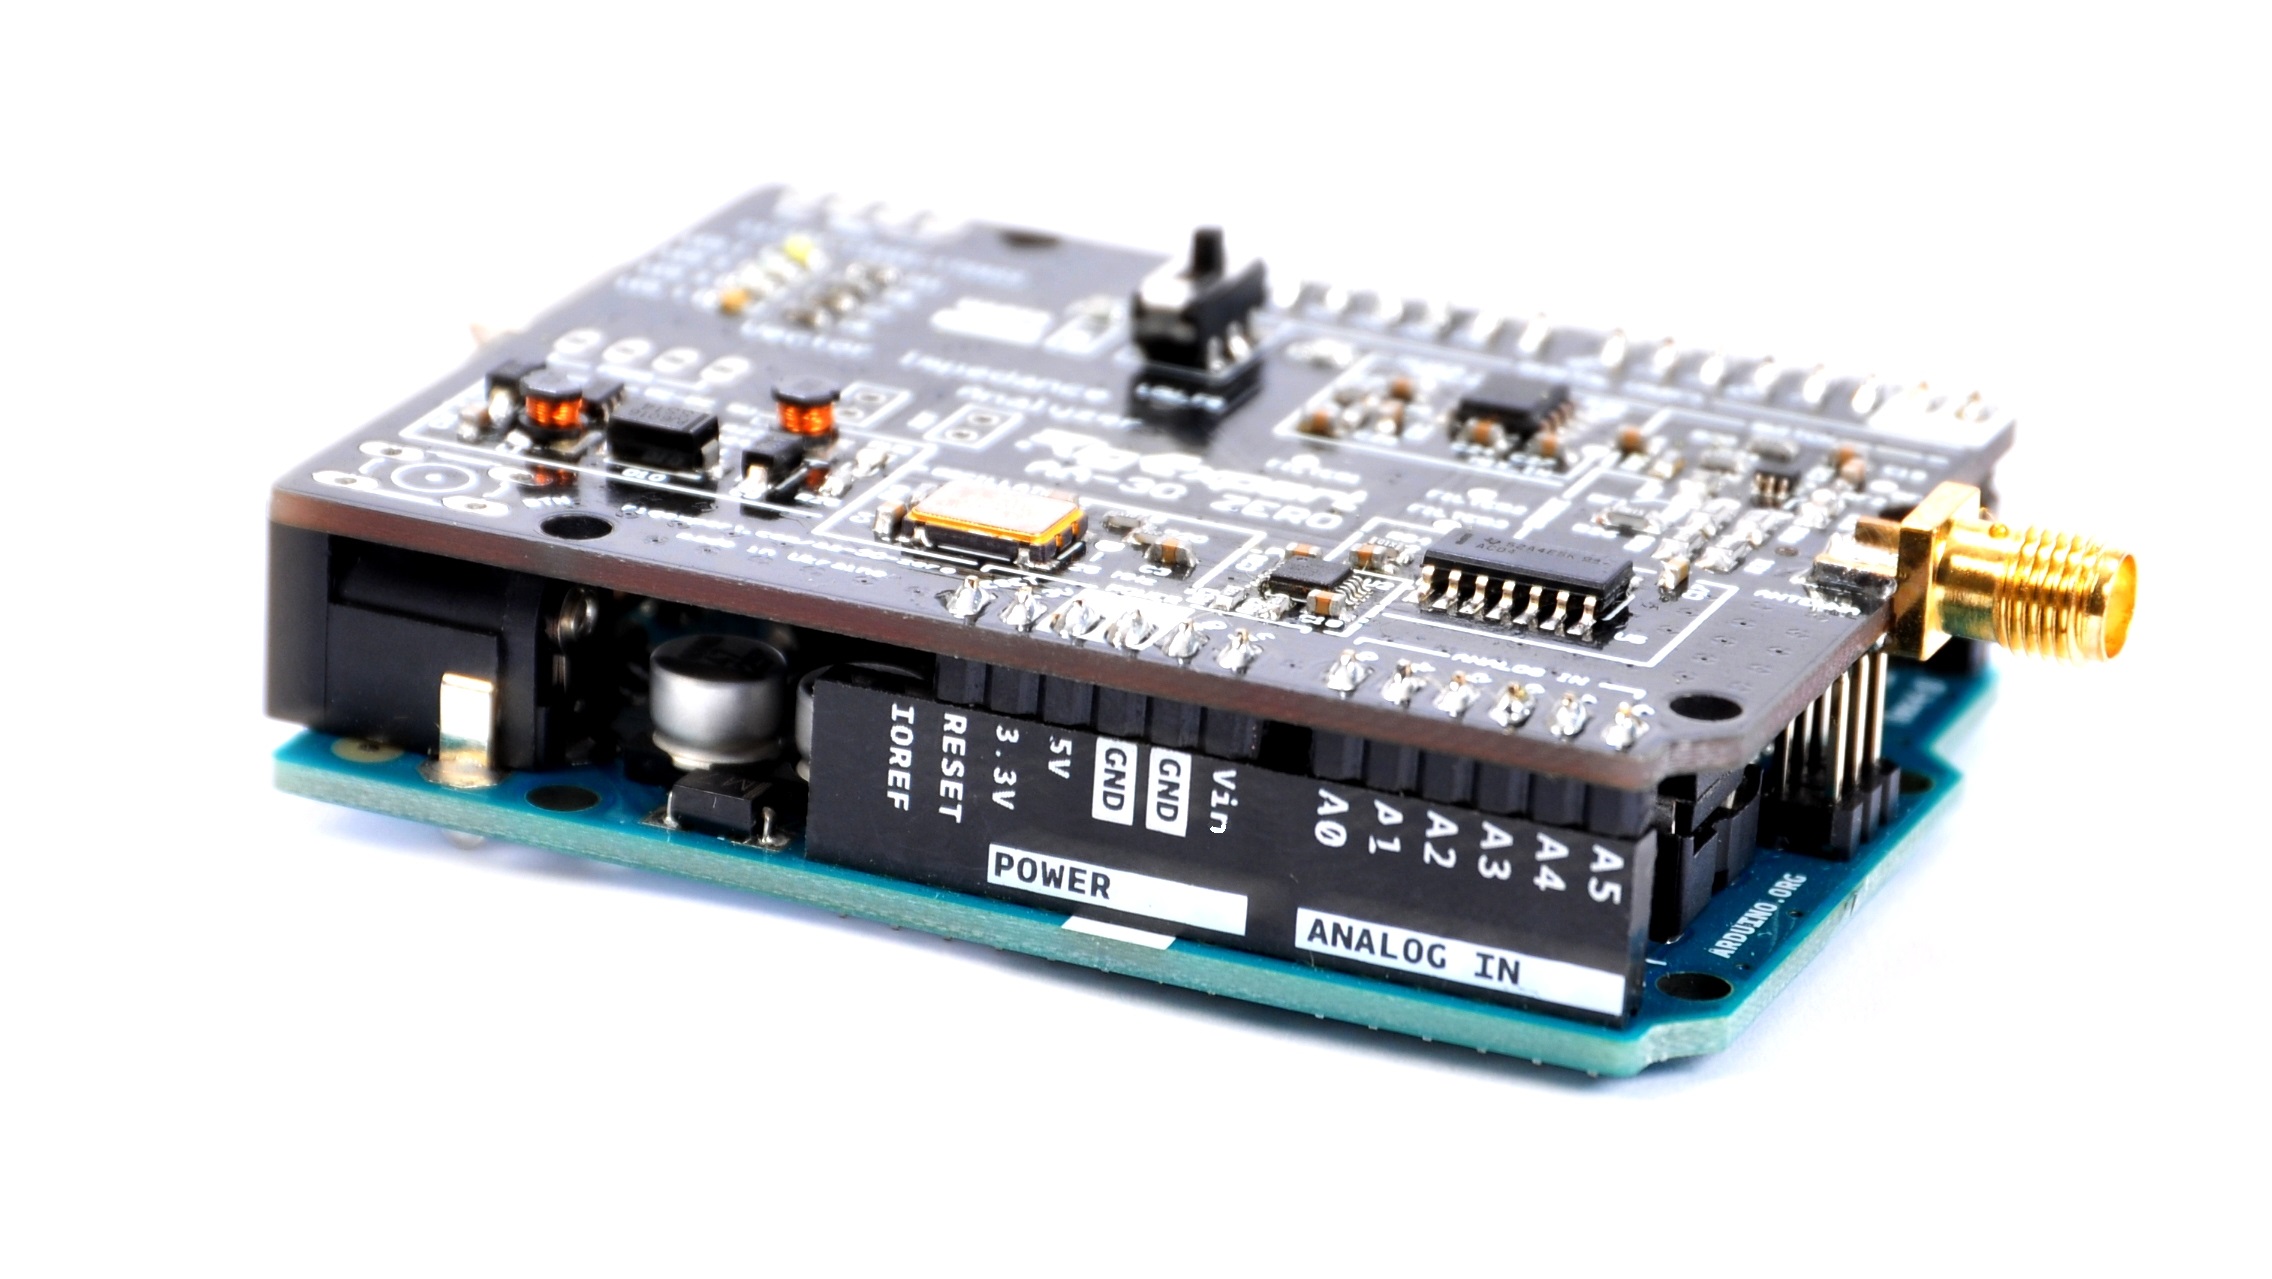
あなたのAA-30.ZEROを制御するための簡単なプログラムです。
/* Rig Expert AA-30.ZERO control via serial port */
/* file name = aa30zero.c */
/* % gcc aa30zero.c -o aa30zero */
/* % ./aa30zero fq7050000 sw100000 frx2 > mydata.txt> mydata.txt */
#include <fcntl.h>
#include <stdio.h>
#include <stdlib.h>
#include <string.h>
#include <sys/wait.h>
#include <termios.h>
#include <time.h>
#include <unistd.h>
#define BUFFSIZE 256
#define BAUDRATE B38400
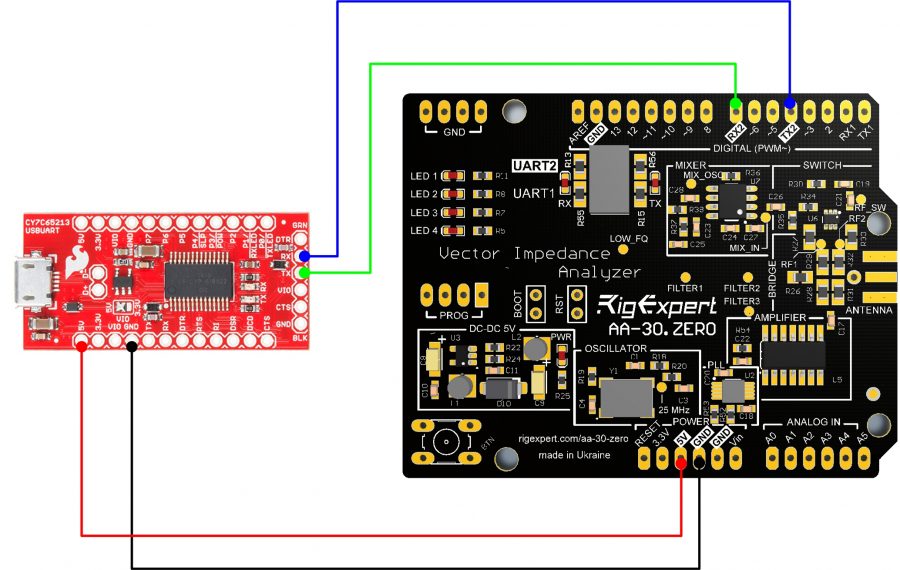
#define MODEMDEVICE "/dev/cu.usbmodem1471"
int fd = -1;
char com_ver[BUFFSIZE] = "ver"; /* returns AA-30 ZERO 150 */
char com_fq[BUFFSIZE]; /* returns OK */
char com_sw[BUFFSIZE]; /* returns OK */
char com_frx[BUFFSIZE]; /* returns OK */
void serial_init(int fd) {
struct termios tio;
memset(&tio, 0, sizeof(tio));
tio.c_cflag = CS8 | CLOCAL | CREAD;
tio.c_cc[VTIME] = 0;
tio.c_lflag = ICANON;
tio.c_iflag = IGNPAR | ICRNL;
cfsetispeed(&tio, BAUDRATE);
cfsetospeed(&tio, BAUDRATE);
tcsetattr(fd, TCSANOW, &tio);
}
void receive_process() {
unsigned char buf[BUFFSIZE];
int count;
int writecount = 0;
int okcount = 0;
while (1) {
count = read(fd, &buf, BUFFSIZE);
if (count <= 0) {
fprintf(stderr, "error count=%d \n", count);
exit(1);
}
if (count > 1) { // exclude ^M only line
for (int i = 0; i < count; i++) {
fprintf(stderr, "%c", buf[i]);
}
}
if (count == 3) { // OK^M
okcount++;
if (okcount == 3) {
return;
}
}
if (count > 15) { // pick only data lines
for (int i = 0; i < count; i++) {
fprintf(stdout, "%c", buf[i]);
}
}
fflush(stdout);
} /* enf of while(1) */
}
void send_command(char *string) {
char buf[BUFFSIZE];
fprintf(stderr, "[%s] \n", string);
int n = strlen(string);
for (int i = 0; i < n; i++) {
buf[i] = *string++;
}
buf[n] = 0x0a;
int nout = n + 1;
int writecount = write(fd, &buf, nout);
}
void send_process() {
sleep(2); send_command(com_ver); // 1 sec is NOT enough
sleep(1); send_command(com_fq);
sleep(1); send_command(com_sw);
sleep(1); send_command(com_frx);
}
int main(int argc, char *argv[]) {
pid_t result_pid;
struct termios oldtio;
if (argc != 4) {
fprintf(stderr, "Usage %s fq7050000 sw100000 frx3 > mydata.txt \n", argv[0]);
exit(1);
}
strcpy(com_fq, argv[1]);
strcpy(com_sw, argv[2]);
strcpy(com_frx, argv[3]);
fd = open(MODEMDEVICE, O_RDWR | O_NOCTTY);
if (fd < 0) {
fprintf(stderr, "file [%s] open error. \n", MODEMDEVICE);
return (-1);
}
tcgetattr(fd, &oldtio);
serial_init(fd);
result_pid = fork();
if (result_pid == -1) {
return (-1);
} else if (result_pid == 0) { // child process
send_process();
_exit(0);
} else { // parent process
receive_process();
tcsetattr(fd, TCSANOW, &oldtio);
exit(0);
}
return 0;
}
このプログラムは以下のようにして使います。
% gcc aa30zero.c -o aa30zero

% ./aa30zero fq7050000 sw100000 frx3 > mydata.txt
[ver]
AA-30 ZERO 150
[fq7050000]
OK
[sw100000]
OK
[frx3]
7.000000,651.849192,-2296.917794
7.033333,520.452206,-2084.028216
7.066666,815.151558,-2043.642265
7.099999,716.516930,-2188.015629
OK

% cat mydata.txt
7.000000,651.849192,-2296.917794
7.033333,520.452206,-2084.028216
7.066666,815.151558,-2043.642265
7.099999,716.516930,-2188.015629
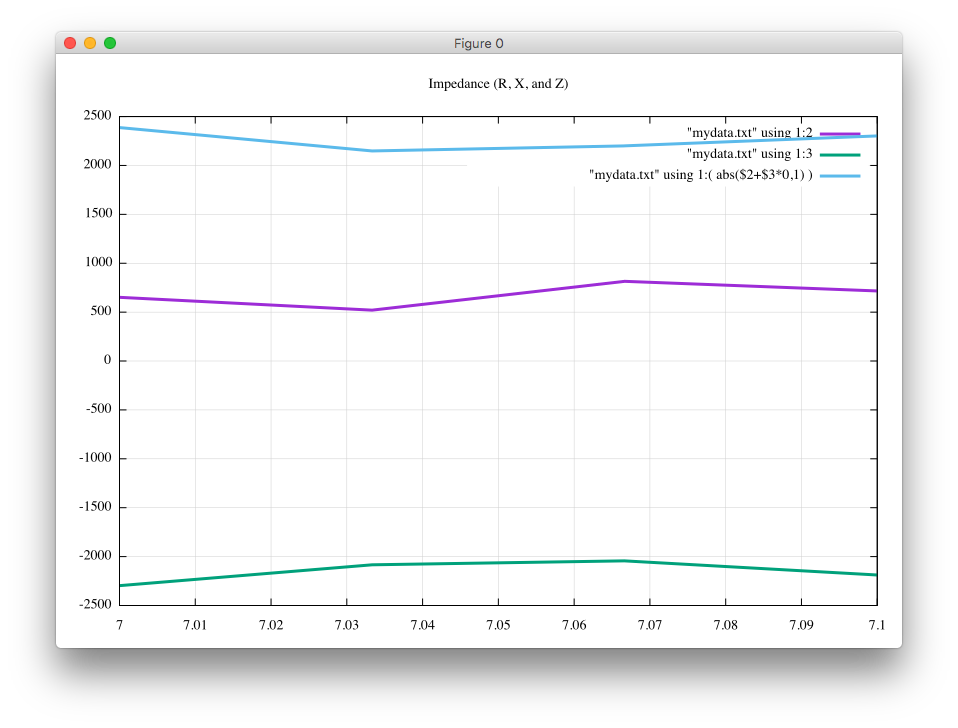
% cat z.plt
reset
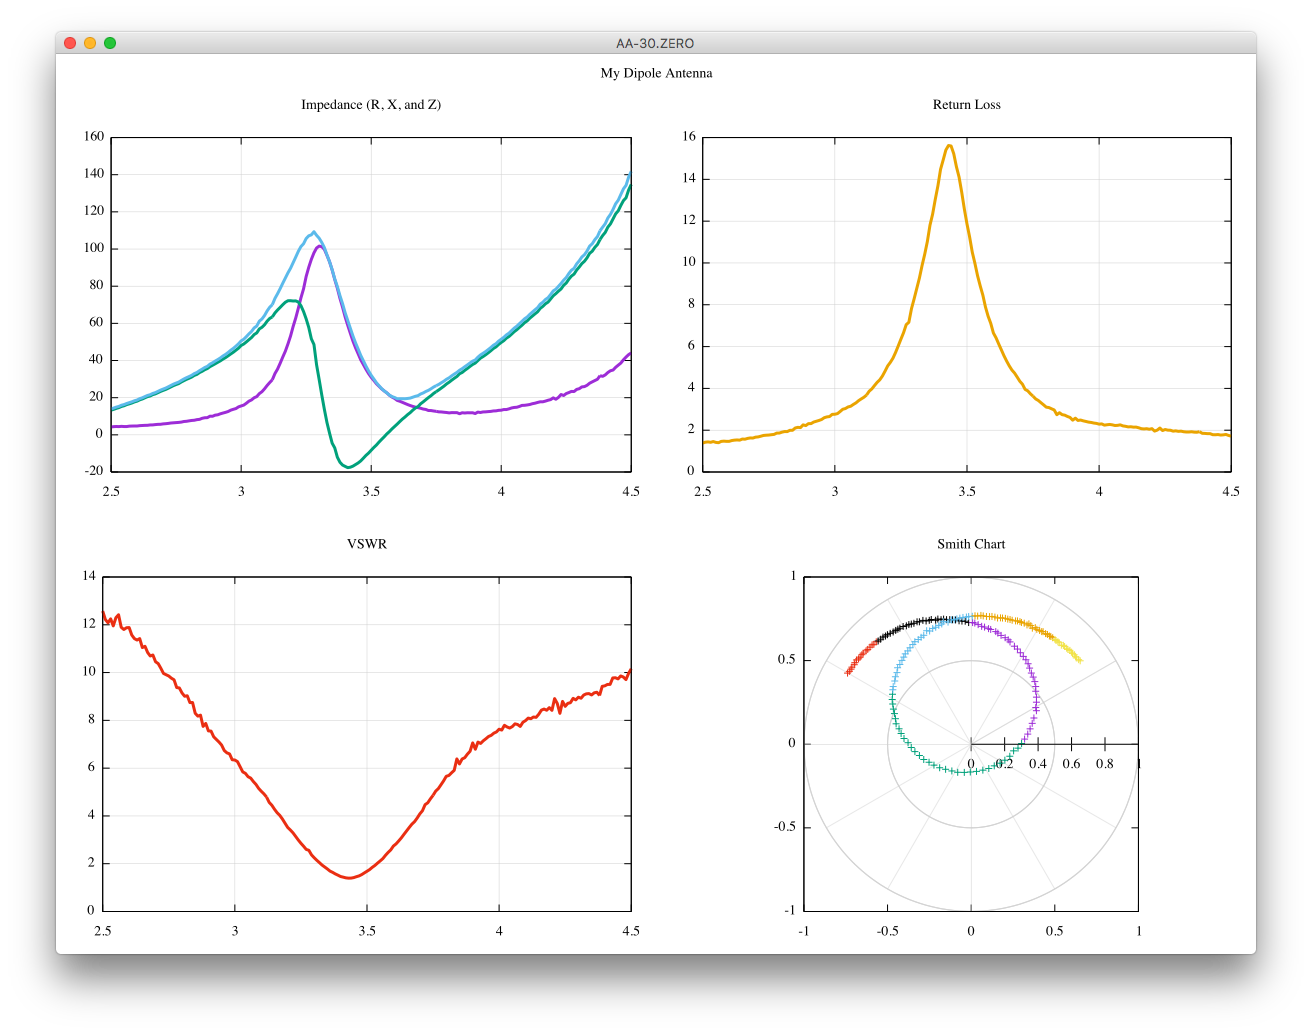
set title "Impedance (R, X, and Z)"
set grid
set datafile separator ","
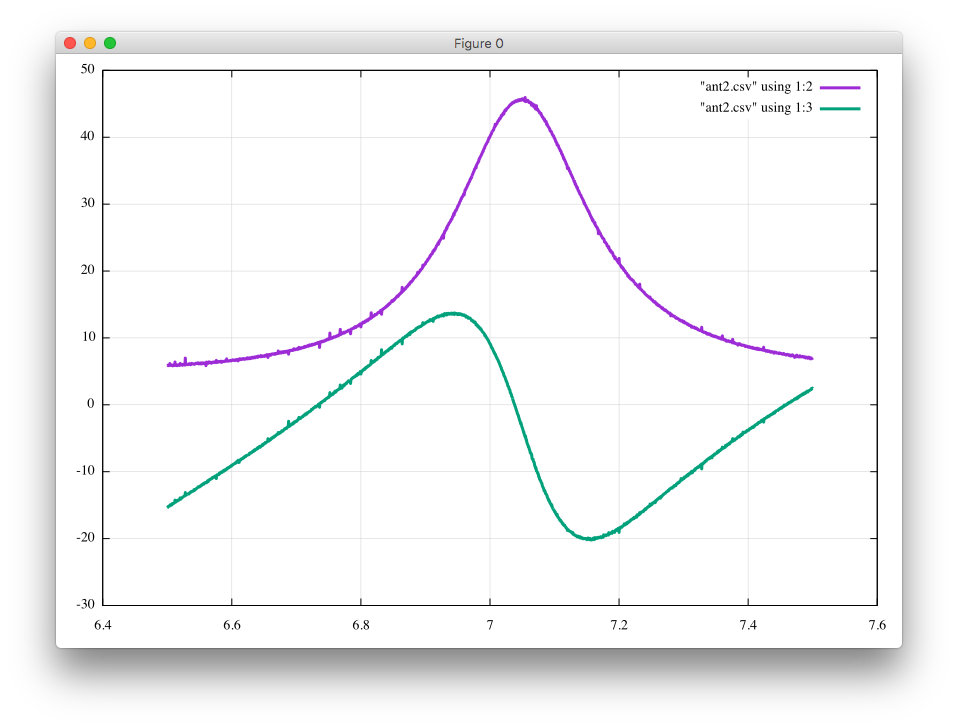
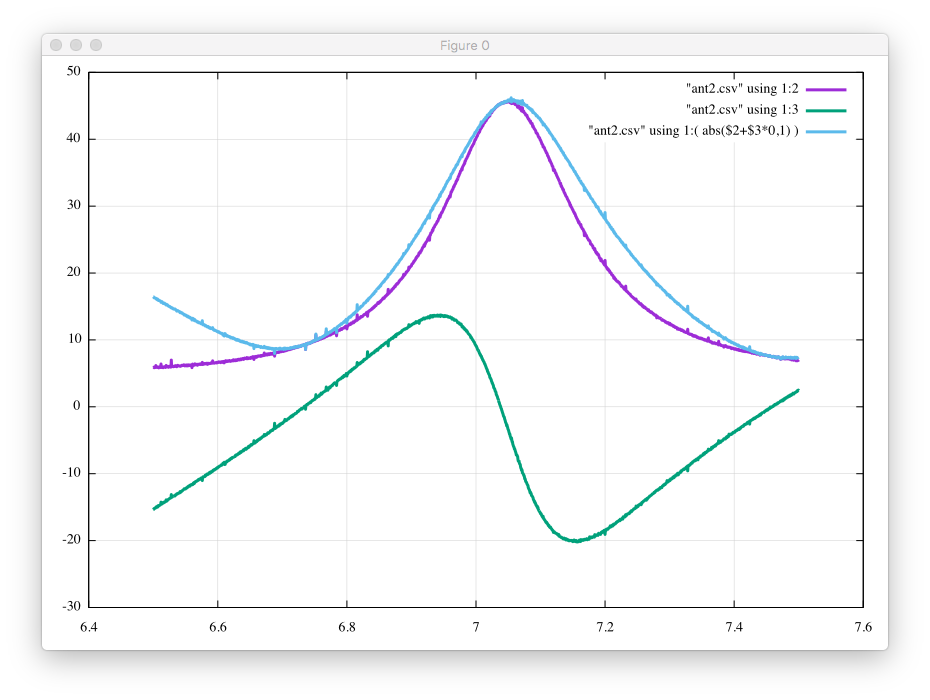
plot "mydata.txt" using 1:2 with line linewidth 3
replot "mydata.txt" using 1:3 with line linewidth 3
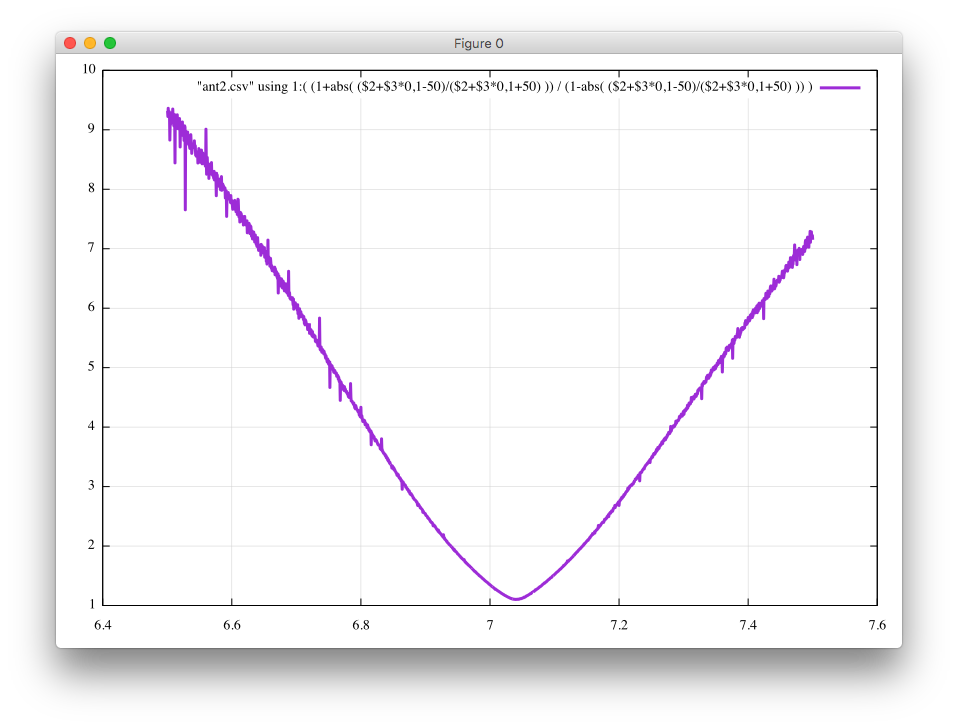
replot "mydata.txt" using 1:( abs($2+$3*{0,1}) ) with line linewidth 3
% gnuplot
gnuplot> load "z.plt"