
Crucial MX300 (275GB)を、私のMac mini (late 2014, macOS Sierra 10.12)に、 USB 3.0経由で接続し、システムドライブとして使っています。

2つの外付けディスクの間で、何か違いがあるでしょうか?


Ham Radio Blog
Crucial MX300 (275GB)を、私のMac mini (late 2014, macOS Sierra 10.12)に、 USB 3.0経由で接続し、システムドライブとして使っています。
2つの外付けディスクの間で、何か違いがあるでしょうか?

あなたは、あなたのplaygroundのassistant editorに、インタラクティブなライブビューを追加することができます。
View > Assistant Editor > Show Assistant Editor
と選択すれば、playgroundにassistant editorが追加されます。
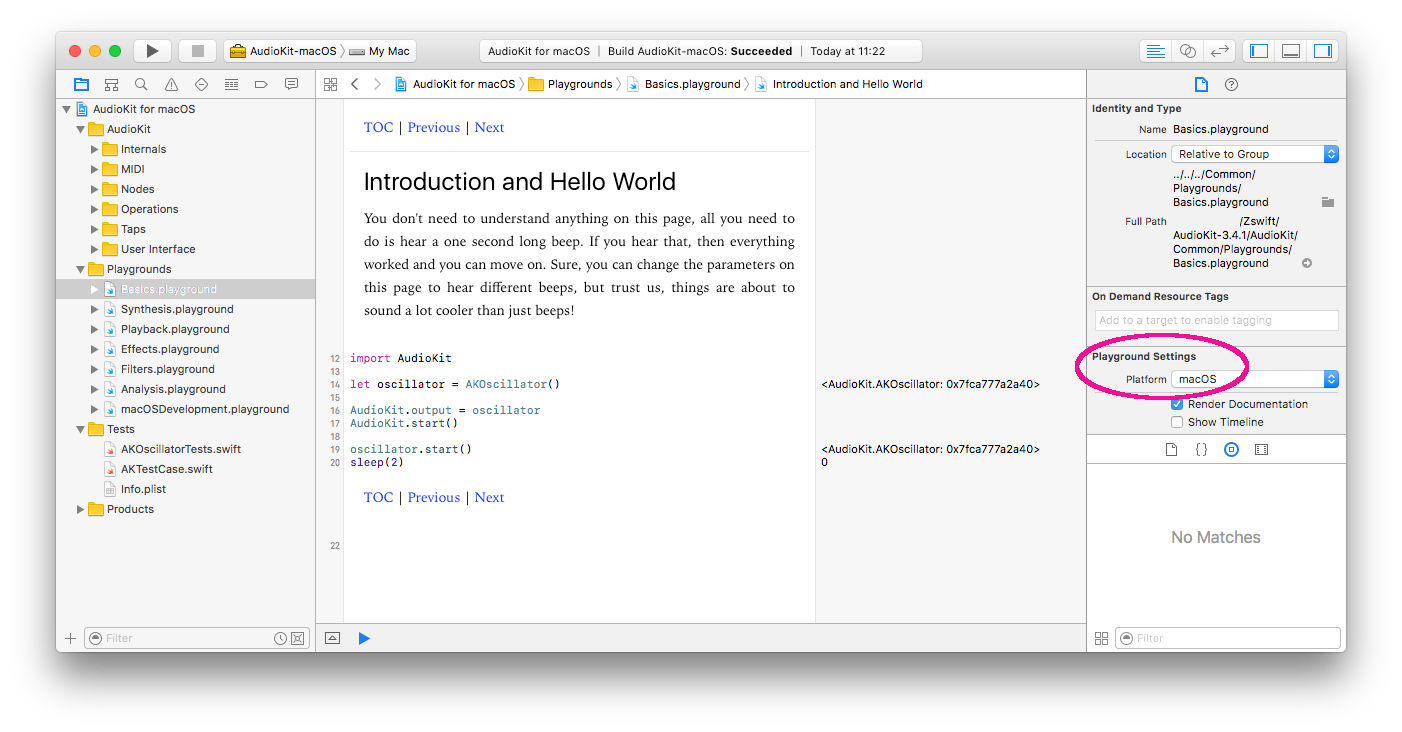
あなたは、AudioKitをインポートしたSwiftプログラムをXcodeのplaygroundで実行して、サウンドを含む結果を直ちに得ることができます。
もし、何も音が聞こえないようであれば、
View -> Utilities -> Show file inspector
で、あなたのPlayground Settingsをチエックして、Platformがあなたの環境に合っているかを確かめて下さい。

サンプルプロジェクトのHello Worldを改造して、固定メッセージCQ TESTを送出します。
//  ViewController.swift

import Cocoa
import AudioKit

class ViewController: NSViewController {

    var oscillator = AKOscillator()

    @IBOutlet var plot: AKOutputWaveformPlot!

    override func viewDidLoad() {
        super.viewDidLoad()

        AudioKit.output = oscillator
        AudioKit.start()
    }

    @IBAction func toggleSound(_ sender: NSButton) {
        oscillator.amplitude = 0.5
        oscillator.frequency = 400
        let message = "cq test"
        let morse: [Character: String] =
            ["c": "1010", "e": "0", "q": "1101", "s": "000",
             "t": "1"   , " ": "0"]
        let weight: [Character: UInt32] = ["1": 150000, "0": 50000]
        let space:       UInt32 =  50000
        let letterSpace: UInt32 = 100000
        let wordSpace:   UInt32 = 300000
        for char in message.characters {
            if char != " " {
                for code in morse[char]!.characters {
                    oscillator.start()
                    usleep(weight!)
                    oscillator.stop()
                    usleep(space)
                }
                usleep(letterSpace)
            } else {
                usleep(wordSpace)
            }
        }
        sender.title = "Send again: " + message
        sender.setNeedsDisplay()
    }
}
私はSwiftプログラミングに関しては完全な初心者ですが、FPGAプログラミングよりは、ずっと容易です。

AudioKitは、iOS、macOS、そしてtvOS用のオーディオ信号処理プラットフォームです。AudioKit v3.4は、Swift 3をサポートするために、Xcode 8が必要であることに注意して下さい。


いまや、5つの異なるアクセスレベル、open、public、internal、fileprivate、そしてprivateが存在します。

% swift
Welcome to Apple Swift version 3.0 (swiftlang-800.0.46.2 clang-800.0.38). Type :help for assistance.
  1> var list = [10, 11, 12]
list: [Int] = 3 values {
  [0] = 10
  [1] = 11
  [2] = 12
}
  2> list.insert(99, at: 1)
  3> print(list)
[10, 99, 11, 12]
  4> public   var r = 1
r: Int = 1
  5> internal let s = 2
s: Int = 2
  6> fileprivate func myfunc() {}
  7> private     func urfunc() {}
あなたは、IBM Swift Sandboxを訪問すれば、Swift 3をインストールせずに試すことができます。


アンテナチューナー(ICOM AH-4)を用いると、同じアンテナでVSWRの値はほぼ1.0になります。
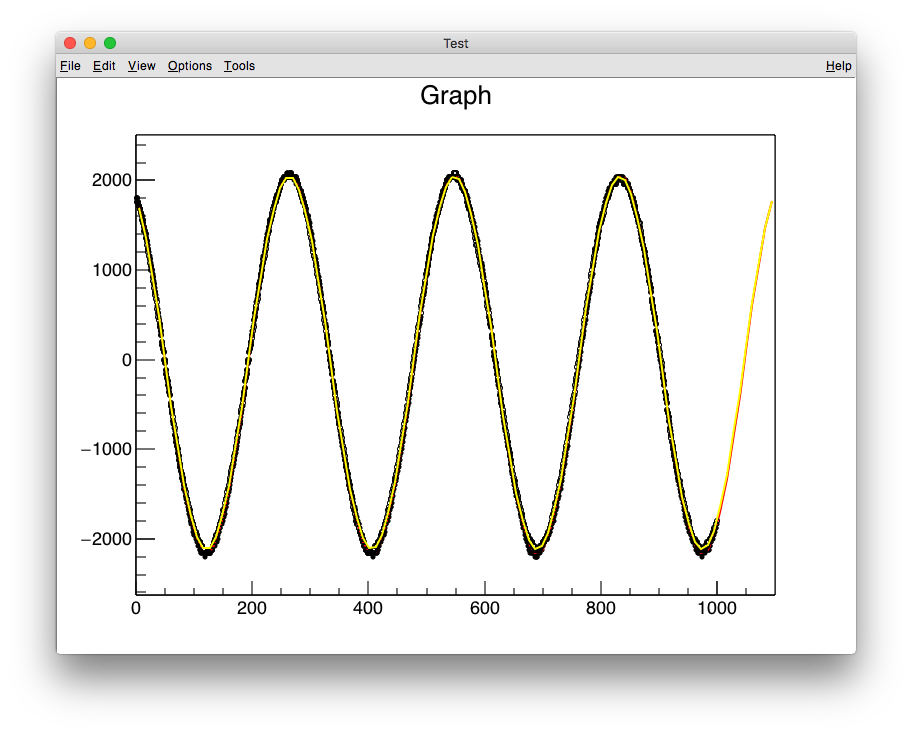
freq1=7.02387 MHz, freq2=7.02408 MHz
amp(v2/v1)=0.985099, phase(v2/v1)=0.00860836 rad
v1=(1,0i), v2=(0.985063,0.00847999i), v3=(1.01494,-0.00847999i)
z=(0.970428,0.0164633i), z50=(48.5214,0.823164i)
gamma=(-0.0149372,0.00847999i), abs=0.0171765, arg=150.416 deg
vswr=1.03495
cable_length=20 m, velocity_factor=0.67 , phase_toward_load=143 deg

もし、あなたがZ(DUT)だけでなく、あなたのアンテナの放射インピーダンスも知りたければ、あなたは、ケーブルの長さと短縮率に応じて、スミスチャート上で負荷の方向へ移動(反時計回りの回転)しなければなりません。
この図では、青色の点がZ(DUT)を、緑色のそれが放射インピーダンスを示しています。
freq1=7.02687 MHz, freq2=7.02978 MHz
amp(v2/v1)=0.778415, phase(v2/v1)=-0.53185 rad
v1=(1,0i), v2=(0.670893,-0.394757i), v3=(1.32911,0.394757i)
z=(0.382788,-0.410701i), z50=(19.1394,-20.535i)
gamma=(-0.329107,-0.394757i), abs=0.51395, arg=-129.818 deg
vswr=3.1148
cable_length=20 m, velocity_factor=0.67, phase_toward_load=143 deg
// file name = mytest46.cc
{
  ifstream finput("owondata.txt");
  Int_t iskip=8;
  std::string s;

  for(Int_t i=0;i<iskip;i++) {
    getline(finput, s);
  }

  const Int_t icount_max=8192;
  Int_t icount=0;
  Double_t dummy, data1[icount_max], data2[icount_max], data3[icount_max];
  while(icount < icount_max) {
    finput >> data1[icount] >> dummy >> data2[icount] >> data3[icount];
    if(finput.eof()) break;
    icount++;
  }

  TCanvas *c1 = new TCanvas("c1","Test",0,0,800,600);
  TGraph *g = new TGraph(icount, data1, data2);
  g->SetMarkerStyle( 20 );
  g->SetMarkerSize( 0.5 );
  g->Draw("AP");
  TF1 *f1 = new TF1("f1", "[0]*sin([1]*x+[2])-[3]");
  f1->SetParameter(0, 2000.0);
  f1->SetParameter(1, 0.022);
  f1->SetParameter(2, 0.0);
  f1->SetParameter(3, 0.0);
  f1->SetLineColor(kRed);
  g->Fit(f1);

  TGraph *h = new TGraph(icount, data1, data3);
  h->SetMarkerStyle( 24 );
  h->SetMarkerSize( 0.5 );
  h->Draw("P");
  TF1 *f2 = new TF1("f2", "[0]*sin([1]*x+[2])-[3]");
  f2->SetParameter(0, 2000.0);
  f2->SetParameter(1, 0.022);
  f2->SetParameter(2, 0.0);
  f2->SetParameter(3, 0.0);
  f2->SetLineColor(kYellow);
  h->Fit(f2);

  Double_t freq1, freq2;
  const Double_t fsample = 2000.0; // MHz (interpolated)
  freq1 = fsample / ( 2.0*TMath::Pi() / f1->GetParameter(1) );
  freq2 = fsample / ( 2.0*TMath::Pi() / f2->GetParameter(1) );
  std::cout << "freq1=" << freq1 << " MHz, freq2=" << freq2 << " MHz" << std::endl;

  Double_t amp, phase;
  amp   = f2->GetParameter(0) / f1->GetParameter(0);
  phase = f2->GetParameter(2) - f1->GetParameter(2);
  std::cout << "amp(v2/v1)=" << amp << ", phase(v2/v1)=" << phase << " rad" << std::endl;

  TComplex v1, v2, v3, Z, z50;
  v1  = TComplex(1.0, 0.0);
  v2  = TComplex( amp*TMath::Cos(phase), amp*TMath::Sin(phase) );
  v3  = 2.0*v1 - v2;
  z   = v2/v3;
  z50 = 50.0*z;
  std::cout << "v1=" << v1 << ", v2=" << v2 << ", v3=" << v3 << std::endl;
  std::cout << "z=" << z << ", z50=" << z50 << std::endl;

  TComplex gg;
  Double_t gg_rho, gg_theta, vswr;
  gg  = (z-1.0)/(z+1.0);
  vswr = (1.0+TComplex::Abs(gg)) / (1.0-TComplex::Abs(gg));

  std::cout << "gamma=" << gg
            << ", abs=" << gg.Rho()
            << ", arg=" << gg.Theta()*360.0/(2.0*TMath::Pi()) << " deg" << std::endl;
  std::cout << "vswr=" << vswr << std::endl;

  TCanvas * CPol = new TCanvas("CPol", "Test", 900, 0, 600, 600);
  const Int_t ncircle = 360;

  Double_t radius[ncircle];
  Double_t theta [ncircle];
  for (Int_t i=0; i<ncircle; i++) {
    radius[i] = gg.Rho();
    theta [i] = TMath::Pi()*2.0*(Double_t)i/(Double_t)(ncircle-1);
  }

  Double_t radius_r[ncircle];
  Double_t theta_r [ncircle];
  Double_t r_center = z.Re() / (z.Re()+1.0);
  Double_t r_radius = 1.0    / (z.Re()+1.0);
  for (Int_t i=0; i<ncircle; i++) {
    Double_t th = TMath::Pi()*2.0*(Double_t)i/(Double_t)(ncircle-1);
    Double_t re = r_center + r_radius*TMath::Cos(th);
    Double_t im =            r_radius*TMath::Sin(th);
    TComplex ww = TComplex(re, im);
    radius_r[i] = ww.Rho  ();
    theta_r [i] = ww.Theta();
  }

  Double_t radius_x[ncircle];
  Double_t theta_x [ncircle];
  TComplex x_center = TComplex(1.0, 1.0/z.Im());
  Double_t x_radius = 1.0/ z.Im();
  for (Int_t i=0; i<ncircle; i++) {
    Double_t th = TMath::Pi()*2.0*(Double_t)i/(Double_t)(ncircle-1);
    Double_t re = x_center.Re() + x_radius*TMath::Cos(th);
    Double_t im = x_center.Im() + x_radius*TMath::Sin(th);
    TComplex ww = TComplex(re, im);
    radius_x[i] = ww.Rho  ();
    theta_x [i] = ww.Theta();
  }

  TGraphPolar * grP1 = new TGraphPolar(ncircle, theta, radius);
  grP1->SetTitle("Smith Chart");
  grP1->SetMarkerStyle(20);
  grP1->SetMarkerSize(2.0);
  grP1->SetMarkerColor(4);
  grP1->SetLineColor(2);
  grP1->SetLineWidth(3);
  grP1->Draw("C");
  CPol->Update();

  grP1->GetPolargram()->SetToRadian();
  grP1->GetPolargram()->SetRangeRadial(0,1);

  TGraphPolar * grP2 = new TGraphPolar(ncircle, theta_r, radius_r);
  grP2->SetMarkerStyle(20);
  grP2->SetMarkerSize(2.0);
  grP2->SetMarkerColor(4);
  grP2->SetLineColor(9);
  grP2->SetLineWidth(3);
  grP2->Draw("C");

  TGraphPolar * grP3 = new TGraphPolar(ncircle, theta_x, radius_x);
  grP3->SetMarkerStyle(20);
  grP3->SetMarkerSize(2.0);
  grP3->SetMarkerColor(4);
  grP3->SetLineColor(6);
  grP3->SetLineWidth(3);
  grP3->Draw("C");

  TMarker *m0 = new TMarker(gg.Re(), gg.Im(), 20);
  m0->SetMarkerSize(2.0);
  m0->SetMarkerColor(4);
  m0->Draw();

  Double_t freq = (freq1+freq2)/2.0; // MHz
  Double_t cable_length = 20.0; // meter
  Double_t velocity_factor = 0.67;
  Double_t wave_length = velocity_factor * (300.0 / freq);
  Double_t phase_toward_load = 2.0 * 2.0 * TMath::Pi() * (cable_length / wave_length);
  std::cout << "cable_length=" << cable_length
            << " m, velocity_factor=" << velocity_factor
            << ", phase_toward_load=" << (Int_t) ( phase_toward_load * 360.0 / (2.0*TMath::Pi()) ) % 360
            << " deg" << std::endl;

  TComplex gg_toward_load = gg * TComplex::Exp(TComplex(0.0, phase_toward_load));

  TMarker *m1 = new TMarker(gg_toward_load.Re(), gg_toward_load.Im(), 20);
  m1->SetMarkerSize(2.0);
  m1->SetMarkerColor(8);
  m1->Draw();
}

ひとたび、あなたがZ(DUT)を、従って、反射係数を得れば、ROOTを使ってスミスチャートを描くことができます。スミスチャートとは、半径1の範囲に制限した複素平面上に極座標で反射係数をプロットしたものに過ぎないことに注意して下さい。
図では、青色の点は反射係数(-0.328107, -0.394757i)、即ち、(0.51395, -129.818 deg)を表しています。赤色の円は反射係数の絶対値が一定の円、即ち、VSWRが一定の円を表しています。
あなたのアンテナと測定回路との間にある同軸ケーブルの長さが異なれば、青色の点は異なる場所に現れますが、それらは常に同じ赤色の円上にあります。もし、ケーブル損失を無視すればですが。
// file name = mytest45.cc
{
  ifstream finput("owondata2.txt");
  Int_t iskip=8;
  std::string s;

  for(int i=0;i<iskip;i++) {
    getline(finput, s);
  }

  const Int_t icount_max=8192;
  Int_t icount=0;
  Double_t dummy, data1[icount_max], data2[icount_max], data3[icount_max];
  while(icount < icount_max) {
    finput >> data1[icount] >> dummy >> data2[icount] >> data3[icount];
    if(finput.eof()) break;
    icount++;
  }

  TCanvas *c1 = new TCanvas("c1","Test",0,0,800,600);
  TGraph *g = new TGraph(icount, data1, data2);
  g->SetMarkerStyle( 20 );
  g->SetMarkerSize( 0.5 );
  g->Draw("AP");
  TF1 *f1 = new TF1("f1", "[0]*sin([1]*x+[2])-[3]");
  f1->SetParameter(0, 2000.0);
  f1->SetParameter(1, 0.022);
  f1->SetParameter(2, 0.0);
  f1->SetParameter(3, 0.0);
  f1->SetLineColor(kRed);
  g->Fit(f1);

  TGraph *h = new TGraph(icount, data1, data3);
  h->SetMarkerStyle( 24 );
  h->SetMarkerSize( 0.5 );
  h->Draw("P");
  TF1 *f2 = new TF1("f2", "[0]*sin([1]*x+[2])-[3]");
  f2->SetParameter(0, 2000.0);
  f2->SetParameter(1, 0.022);
  f2->SetParameter(2, 0.0);
  f2->SetParameter(3, 0.0);
  f2->SetLineColor(kYellow);
  h->Fit(f2);

  double amp, phase;
  amp   = f2->GetParameter(0) / f1->GetParameter(0);
  phase = f2->GetParameter(2) - f1->GetParameter(2);
  std::cout << "amp=" << amp << ", phase=" << phase << std::endl;

  TComplex v1, v2, v3, Z, z50;
  v1  = TComplex(1.0, 0.0);
  v2  = TComplex( amp*TMath::Cos(phase), amp*TMath::Sin(phase) );
  v3  = 2.0*v1 - v2;
  z   = v2/v3;
  z50 = 50.0*z;
  std::cout << "v1=" << v1 << ", v2=" << v2 << ", v3=" << v3 << ", z=" << z << ", z50=" << z50 << std::endl;

  TComplex gg;
  double gg_rho, gg_theta, vswr;
  gg  = (z-1.0)/(z+1.0);
  vswr = (1.0+TComplex::Abs(gg)) / (1.0-TComplex::Abs(gg));

  std::cout << "gg=" << gg << ", abs=" << TComplex::Abs(gg) << std::endl;
  std::cout << "gg=" << gg.Rho() << ", " << gg.Theta()*360.0/(2.0*TMath::Pi())  << std::endl;
  std::cout << "vswr=" << vswr << std::endl;

  TCanvas * CPol = new TCanvas("CPol", "Test", 900, 0, 600, 600);
  const Int_t ncircle = 360;

  Double_t radius[ncircle];
  Double_t theta [ncircle];
  for (int i=0; i<ncircle; i++) {
    radius[i] = gg.Rho();
    theta [i] = TMath::Pi()*2.0*(double)i/(double)(ncircle-1);
  }

  Double_t radius_r[ncircle];
  Double_t theta_r [ncircle];
  Double_t r_center = z.Re() / (z.Re()+1.0);
  Double_t r_radius = 1.0    / (z.Re()+1.0);
  for (int i=0; i<ncircle; i++) {
    Double_t th = TMath::Pi()*2.0*(double)i/(double)(ncircle-1);
    Double_t re = r_center + r_radius*TMath::Cos(th);
    Double_t im =            r_radius*TMath::Sin(th);
    TComplex ww = TComplex(re, im);
    radius_r[i] = ww.Rho  ();
    theta_r [i] = ww.Theta();
  }

  Double_t radius_x[ncircle];
  Double_t theta_x [ncircle];
  TComplex x_center = TComplex(1.0, 1.0/z.Im());
  Double_t x_radius = 1.0/ z.Im();
  for (int i=0; i<ncircle; i++) {
    Double_t th = TMath::Pi()*2.0*(double)i/(double)(ncircle-1);
    Double_t re = x_center.Re() + x_radius*TMath::Cos(th);
    Double_t im = x_center.Im() + x_radius*TMath::Sin(th);
    TComplex ww = TComplex(re, im);
    radius_x[i] = ww.Rho  ();
    theta_x [i] = ww.Theta();
  }

  TGraphPolar * grP1 = new TGraphPolar(ncircle, theta, radius);
  grP1->SetTitle("Smith Chart");
  grP1->SetMarkerStyle(20);
  grP1->SetMarkerSize(2.0);
  grP1->SetMarkerColor(4);
  grP1->SetLineColor(2);
  grP1->SetLineWidth(3);
  grP1->Draw("C");
  CPol->Update();

  grP1->GetPolargram()->SetToRadian();
  grP1->GetPolargram()->SetRangeRadial(0,1);

  TGraphPolar * grP2 = new TGraphPolar(ncircle, theta_r, radius_r);
  grP2->SetMarkerStyle(20);
  grP2->SetMarkerSize(2.0);
  grP2->SetMarkerColor(4);
  grP2->SetLineColor(9);
  grP2->SetLineWidth(3);
  grP2->Draw("C");

  TGraphPolar * grP3 = new TGraphPolar(ncircle, theta_x, radius_x);
  grP3->SetMarkerStyle(20);
  grP3->SetMarkerSize(2.0);
  grP3->SetMarkerColor(4);
  grP3->SetLineColor(6);
  grP3->SetLineWidth(3);
  grP3->Draw("C");

  TMarker *m0 = new TMarker(gg.Re(), gg.Im(), 20);
  m0->SetMarkerSize(2.0);
  m0->SetMarkerColor(4);
  m0->Draw();
}
% root mytest45.cc
amp=0.778415, phase=-0.53185
v1=(1,0i), v2=(0.670893,-0.394757i), v3=(1.32911,0.394757i), z=(0.382788,-0.410701i), z50=(19.1394,-20.535i)
gg=(-0.329107,-0.394757i), abs=0.51395
gg=0.51395, -129.818
vswr=3.1148

